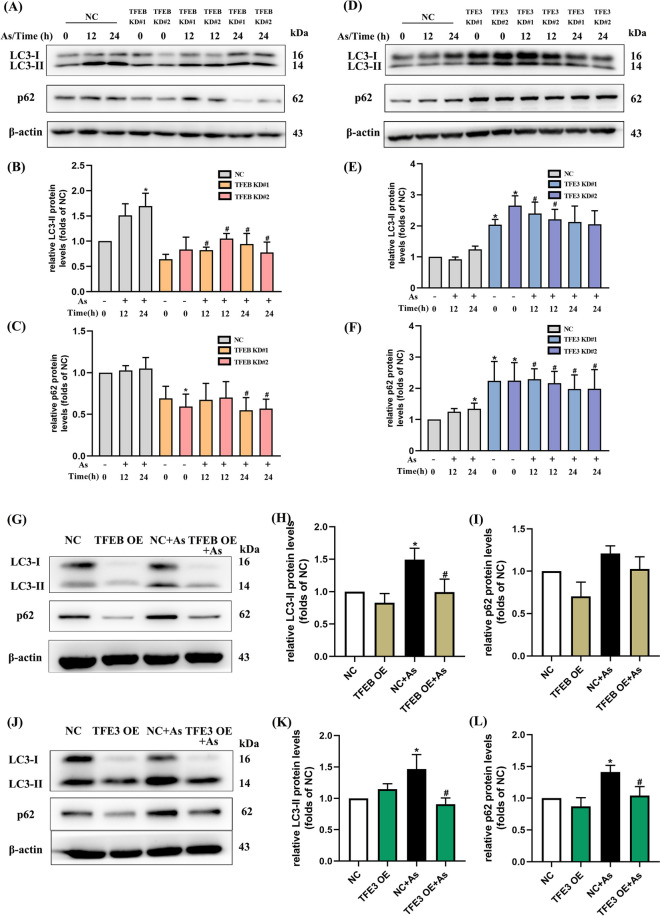
Fig. 8.
Autophagy flux is affected by knockdown or overexpression of TFEB/TFE3 in As-exposed primary BMDCs. A, D Western blotting of LC3-II and p62 exposed to 1 μM As with TFEB or TFE3 knockdown for the times indicated, quantitative analysis are shown in B–C and E–F, respectively (n = 3). G, J Western blotting of LC3-II and p62 exposed to 1 μM As with TFEB or TFE3 overexpression for 12 h, quantitative analysis are shown in H–I and K–L, respectively (n = 6). All summary data are normalized to negative control (NC), and values reflect Mean ± SEM. *P < 0.05 compared with NC group, #P < 0.05 compared with NC + As group

