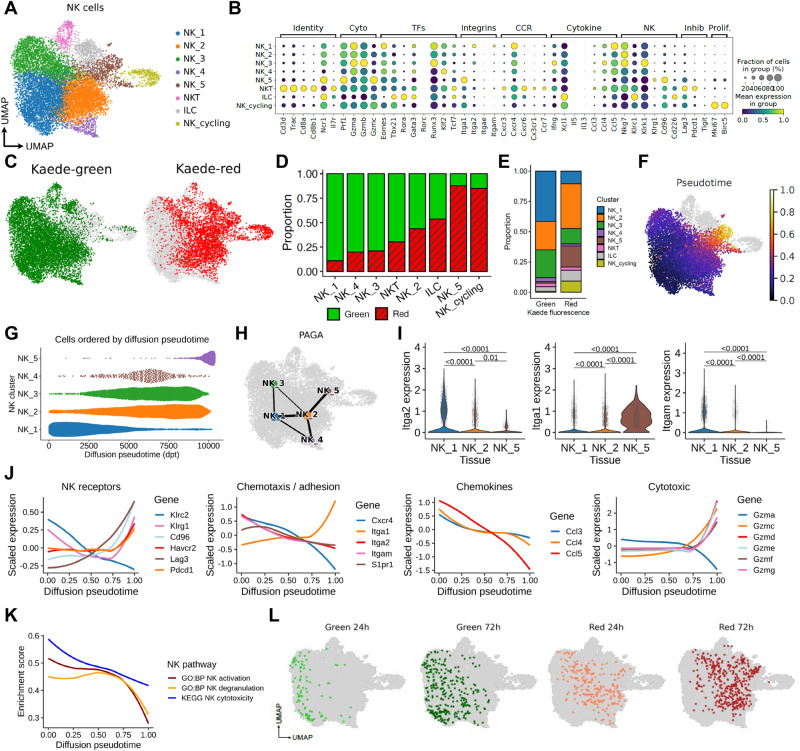
Fig. 1. Rapid changes to the NK cell transcriptome after entry into the TME.
MC38 tumors, grafted subcutaneously on the flank, were photoconverted and analyzed 48 h later using droplet-based scRNA-sequencing. A UMAP showing 11,808 NK cells defined by expression of Ncr1, Prf1, Klrb1c, Fcgr3, resolved into 8 clusters comprised of NK_1 to NK_5, alongside 1 cycling cluster and two further clusters that describe ILC and NKT cells. B Dot plots showing expression of selected genes used to further characterize the clusters. C UMAP showing the distribution of Kaede Green+ and Kaede Red+ cells across the NK clusters. D The proportion of Kaede Green+ and Kaede Red+ cells within each cluster. E Proportion of each cluster within the Kaede Green+ and Kaede Red+ cells. F UMAP showing diffusion pseudotime trajectory rooted in NK_1. G Bee swarm plot of the 5 NK clusters (NK_1 to NK_5) over pseudotime. H PAGA illustrating gene expression relationship between NK clusters. I Violin plots showing expression of Iga1, Itga2, Itgam across NK_1, NK_2 and NK_5. J Differentially expressed genes over pseudotime grouped by function. K Pathway analyses characterizing changes in NK activation, degranulation, and cytotoxicity over pseudotime. L UMAPs showing integration of NK cell data after 24 and 72 h post-photoconversion with the original data derived from 48 h post-labeling. Statistical significance determined by two-sided Wilcoxon rank-sum test with Benjamini-Hochberg multiple-testing correction. Data are shown as box (median; box, 25th percentile and 75th percentile; whiskers, 1.5*inter-quartile range) and violin plots. In (J, K) data are shown as local regression (loess) fit to scaled expression values.

