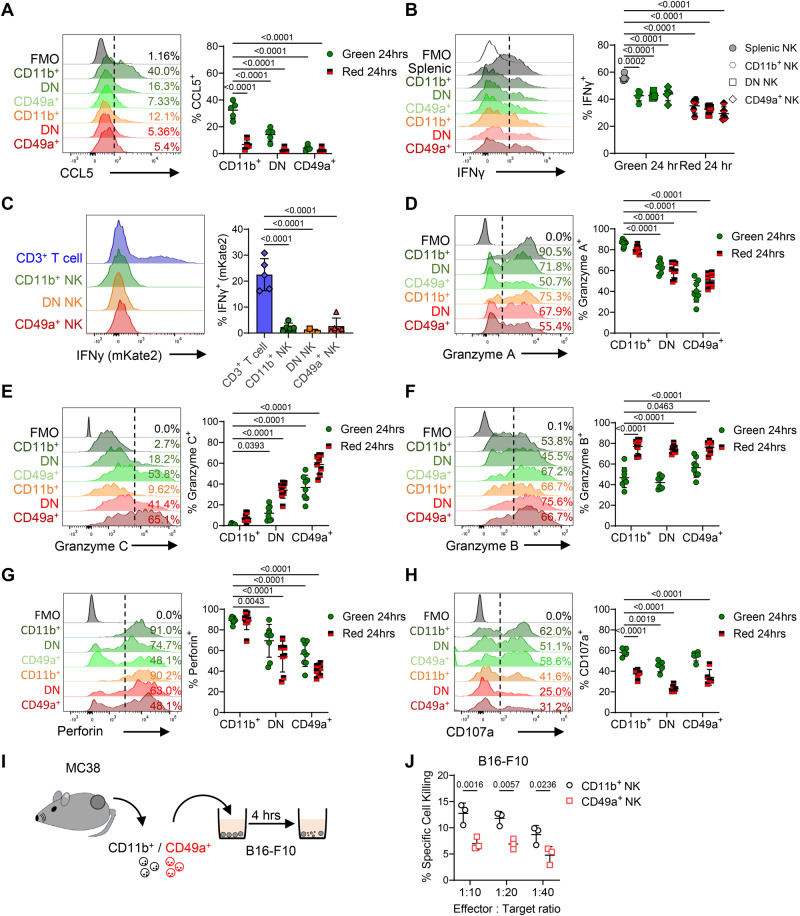
Fig. 3. NK cells rapidly change chemokine, cytokine and granzyme production within 24 h of entering the TME.
Flow cytometry was used to validate changes to the function of NK cells isolated from MC38 tumors at 24 h post photoconversion. A Proportion of NK cells producing CCL5 after ex vivo stimulation, with representative histograms alongside enumeration (n = 5). B Proportion of NK cells producing IFNγ after ex vivo stimulation, with representative histograms alongside enumeration (n = 5). C Reporting of mKate2 in using Ifnγcre/mKate2 reporter mice, with T cells versus NK cells isolated from MC38 tumors assessed. Representative histograms and the proportion of mKate2+ cells shown. Representative histograms showing proportion of NK cells producing (D) granzyme A, (E) granzyme C, (F) granzyme B, (G) CD107a, (H) Perforin in MC38 tumors that were photoconverted and analyzed 24 h later. Data pooled from 2 independent experiments (n = 8) for all analyses except CD107a expression where n = 5 from 1 independent experiment. I Cartoon showing experimental setup whereby CD11b+ and CD49a+ NK cells from MC38 tumors were FACS-isolated and co-cultured with B16-F10 melanoma cells pre-treated with cell trace violet that were then stained for cell viability. J NK-mediated target cell killing comparing cytotoxicity between FACS sorted CD11b+ and CD49a+ NK cells (n = 3). Significance was determined by two-way ANOVA with Šidák’s multiple comparison test (A, B, and D–H) comparing means to Kaede Green+ CD11b+ cells, or between groups (J), and a Kruskal–Wallis test with Dunn’s multiple comparison test (C). Data are presented showing all individual data points as well as the mean value +/- SD. In all experiments ‘n’ defines a single tumor on an individual mouse, i.e., n = 3 refers to 3 mice each with a single tumor.

