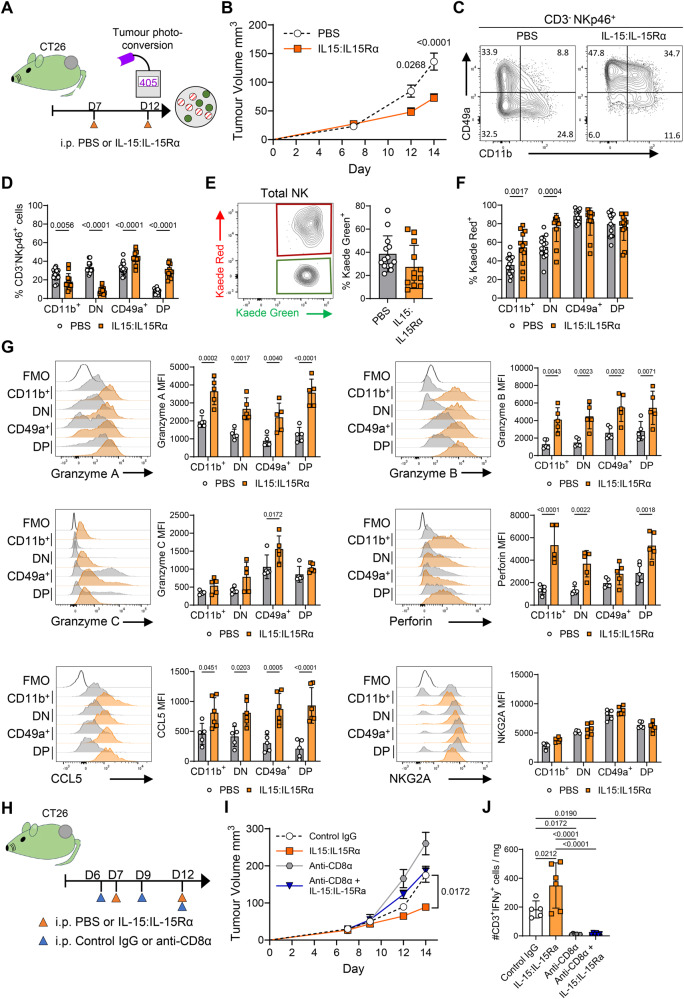
Fig. 6. Administration of IL15:IL15Rα complexes result in enhanced tumor control and the formation of CD49+ CD11b+ intratumoral NK cells with heightened functions.
To block loss of NK cell functions within the tumor, BALB/c Kaede mice bearing CT26 tumors were treated with IL-15:IL-15Ra complexes. A Cartoon showing experimental design. B Growth curves for CT26. C Representative flow cytometry plots expression of CD49a versus CD11b by NK cells (CD3- NKp46+ ). D Proportion of NK cells with CD11b+ CD49a-, CD11b- CD49a-, CD11b- CD49a+ , CD11b+ CD49a+ phenotype. E Representative flow cytometry plot showing Kaede Green versus Kaede Red expression by total NK cells alongside enumeration of % Kaede Green+ NK cells. F Proportion of Kaede Red+ cells within CD11b+ CD49a-, CD11b- CD49a-, CD11b- CD49a+ , CD11b+ CD49a+ subsets of NK cells. Data pooled from 3 independent experiments, (cumulative totals: PBS n = 14, IL15:IL-15Ra n = 12). G Representative histograms and enumeration of granzyme A, granzyme B, granzyme C, perforin, CCL5, and NKG2A (MFI) after ex vivo stimulation (data from 1 of 3 experiments shown, PBS n = 5 and IL-15:IL-15Rα n = 5). H Cartoon showing experimental design for CD8 T cell depletion in combination with IL-15:IL-15Ra complexes (PBS + IgG n = 5, PBS + anti-CD8α n = 6, IL-15:IL-15Rα + IgG n = 6, 15:IL-15Rα + anti-CD8α n = 6). I Tumor growth curve for experiment illustrated in (H). J Total number of NK cells per mg tumor. Statistical significance was determined by two-way ANOVA with Šidák’s multiple comparisons test (B, D, F, G and I), unpaired t test (E), or one-way ANOVA with Tukey’s multiple comparisons test (J). Data are presented showing all individual data points as well as the mean value +/- SD, except (B, I) where mean value +/- SEM are shown. In all experiments ‘n’ defines a single tumor on an individual mouse, i.e., n = 3 refers to 3 mice each with a single tumor.

