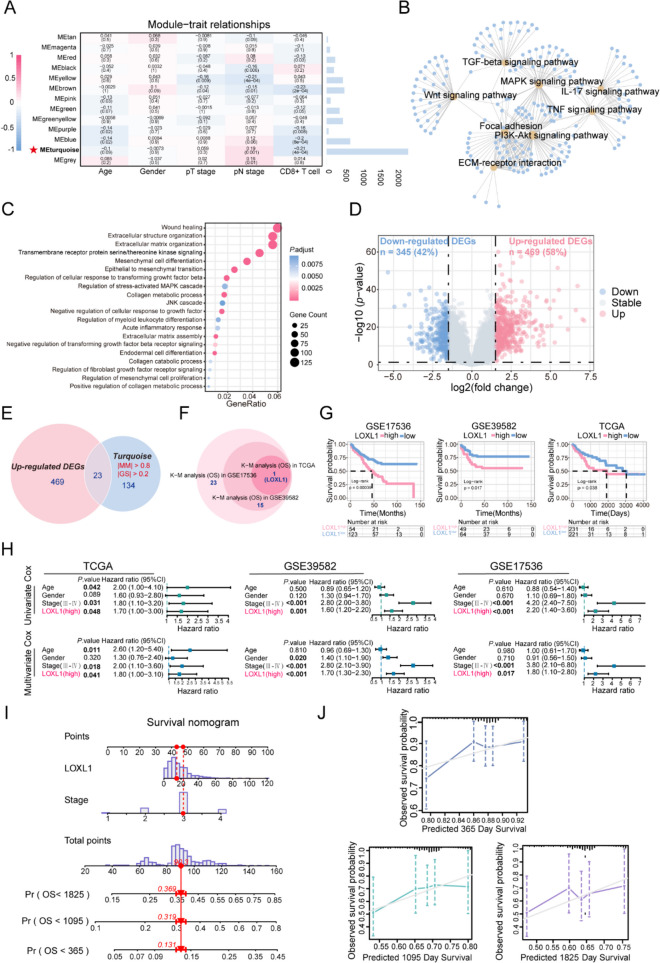
Fig. 1.
Screening of hub module via weighted gene co-expression network analysis (WGCNA) and identification of LOXL1 as a hub gene. (A) Left: Heatmap for the correlation between module eigengenes and clinical traits including pathological T, N stage and CD8 + T cell infiltration level of colorectal cancer (CRC) patients in GSE39582 discovery dataset. Each cell contains corresponding correlation coefficient and P-value. P-values were calculated using Pearson’s correlation analysis. The turquoise module was selected as the most significant module which was positively correlated with pN stage and negatively correlated with CD8 + T cell infiltration. Right: The bar chart indicates the number of genes in each module. (B) Gene Ontology (GO) biological process (BP) enrichment analysis and (C) Kyoto Encyclopedia of Genes and Genomes (KEGG) pathway enrichment analysis for genes in the turquoise module. A p-value less than 0.05 indicated statistical significance. (D) The GSE39582 validation dataset which contains 19 colorectal adjacent normal tissues and 123 colorectal tumor tissues was used to examine the differentially expressed genes (DEGs) between normal and tumor tissues. 814 DEGs including 469 up-regulated and 345 down-regulated genes were identified and selected to draw a volcano plot. The red and blue dots represent significantly up-regulated and down-regulated genes respectively (|log2FC|> 1.5, P < 0.01), and grey dots represent genes without significant expression changes. (E) The Venn diagram depicted the overlapping genes between up-regulated DEGs and genes in the turquoise module. A total of 23 overlapping hub genes were obtained. (F) The circle plot determined that LOXL1 was the only gene significantly associated with patient’s overall survival in the GSE17536 cohort, GSE39582 cohort and TCGA-COAD cohort. (G) The Kaplan–Meier curves showed that high expression of LOXL1 was correlated with poor survival rate of CRC patients in GSE17536 cohort, GSE39582 cohort, and TCGA-COAD cohort. Optimal separation cut-off value was used to achieve best statistical significance. (H) Univariate and multivariate Cox proportional hazards regression analysis showed independent factors for overall survival (OS) in TCGA-COAD cohort, GSE39582 cohort and GSE17536 cohort. Forest plot presents the hazard ratio (HR) value and 95% confidence interval (CI). (I) A nomogram combining LOXL1 expression and pathological stage was constructed to predict the 1-, 3-, and 5-year overall survival probability of CRC patients. The red line and arrows represent an example of designated points. (J) Calibration curves were used to validate the consistency between predicted nomogram results and the actual 1-, 3-, and 5-year survival outcomes. The y-axis represents the measured survival probabilities. The x-axis represents the nomogram-predicted survival probabilities. The diagonal grey solid line represents the ideal nomogram, and the blue, green, purple line represents the 1-, 3-, and 5-year observed nomograms respectively

