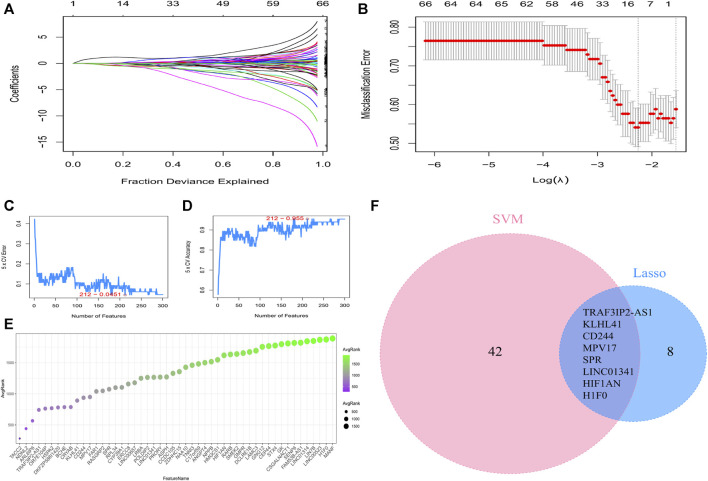
FIGURE 4.
Machine learning screening of the characteristic genes. (A) LASSO coefficient curves. (B) Determination of the optimal penalty coefficient (lambda) and the minimum absolute shrinkage criterion in the Lasso regression. (C) Error rate of genes identified by SVM-RFE machine learning. (D) Accuracy rate of genes identified by SVM-RFE machine learning. (E) The top 50 genes with the highest accuracy by SVM-RFE. (F) Venn diagrams to identify the characteristic genes based on LASSO and SVM-RFE screening.

