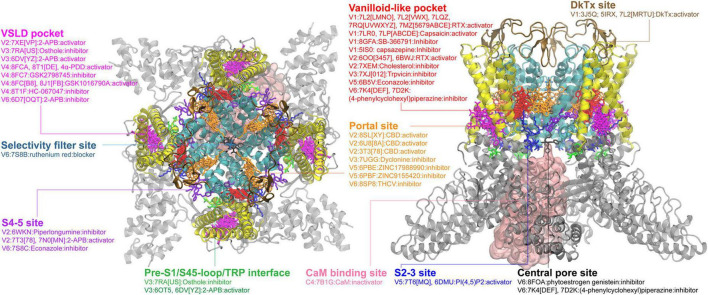
FIGURE 1.
Ligand binding sites in TRPV channels. The TRPV1 structure in complex with DkTx (PDB: 3J5Q) is used for visualizing the binding sites, with the pore region, the VSLD region and cytosolic domain colored in cyan, yellow and gray, respectively. All other structures were first structurally aligned using US-align (Zhang et al., 2022) to allow the clustering of all ligands observed. The major binding pockets or interfaces in the TRPV channels are highlighted using clusters of ligands shown in different colors. The side view in the right panel is rendered by rotating along the x-axis of the top view (the left panel) by 90° and then along the y-axis by 45° for a better view of the binding sites. Some ligands can have multiple binding poses within the same pocket; only one configuration is shown for clarity. Binding sites for ions or ion blockers are not shown.

