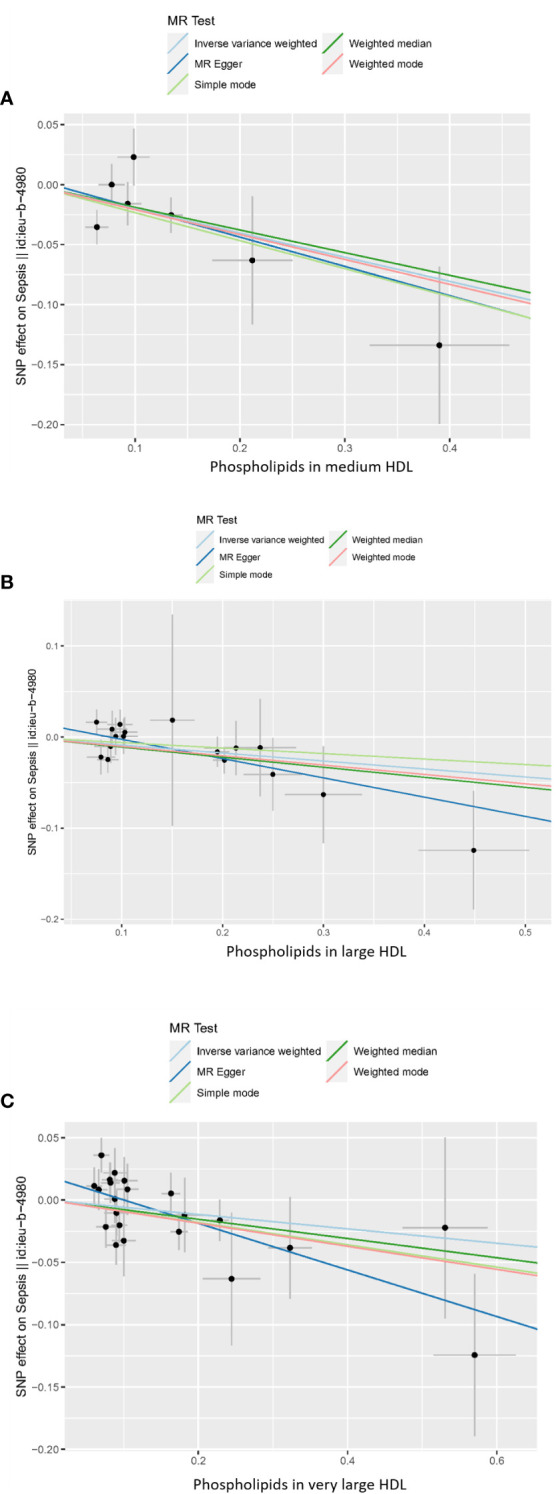
Figure 2.

Scatter plot of the causal relationship between HDL-associated phospholipids and sepsis. (A) Phospholipids in medium HDL. (B) Phospholipids in large HDL. (C) Phospholipids in very large HDL. Analyses were conducted using IVW, weighted median, weighted mode, simple mode, and MR Egger methods. The slope of the line indicates the magnitude of the causal relationship. Error bars indicate 95% CI. MR, mendelian randomization; SNP, single nucleotide polymorphism.
