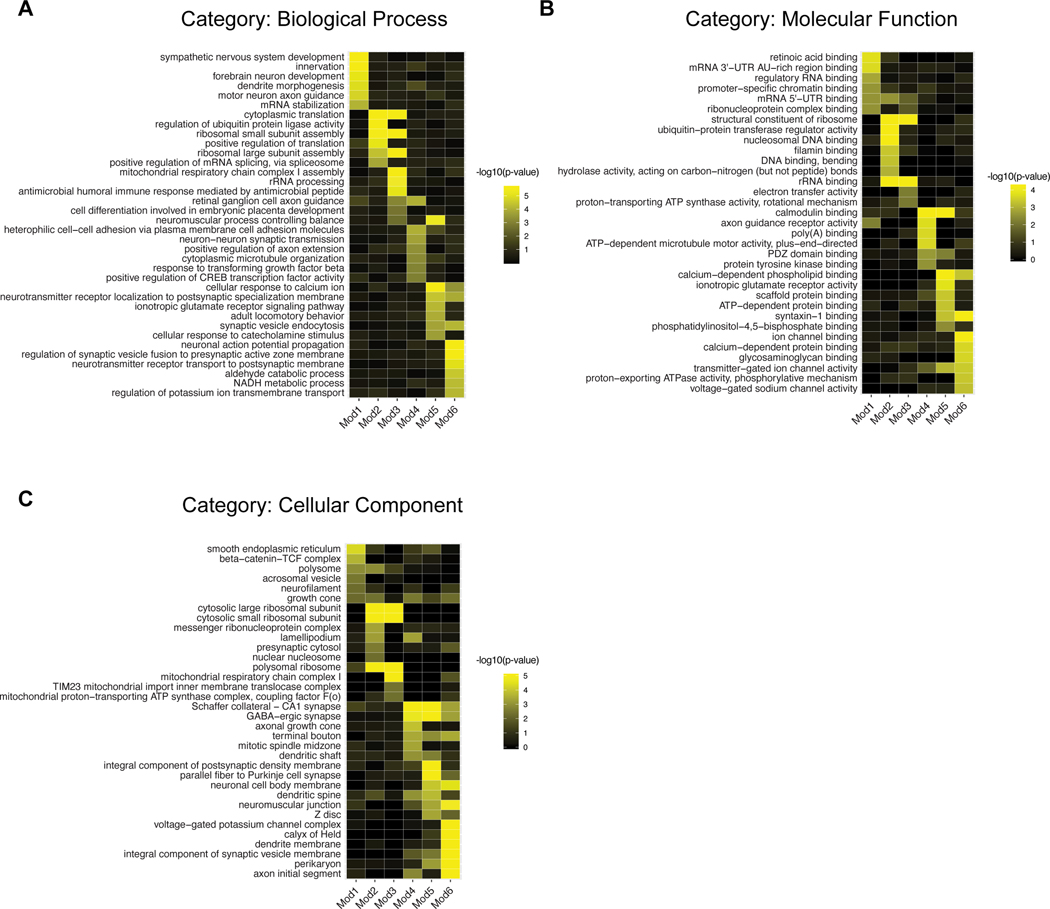
Figure 3. Gene Ontology (GO) analysis of temporally regulated gene modules Mod1–6.
A. Examples of significantly enriched Gene Ontology (GO) category “Biological Process (BP)” terms (rows) in Mod1–6 (columns). Colors correspond to enrichment corrected p-values (−log10 units). GO analaysis was performed using the R package topGO (Alexa and Rahnenführer, 2009).
B. Same as A, for GO category “Molecular Function (MF)”.
C. Same as A, for GO category “Cellular Component (CC)”.

