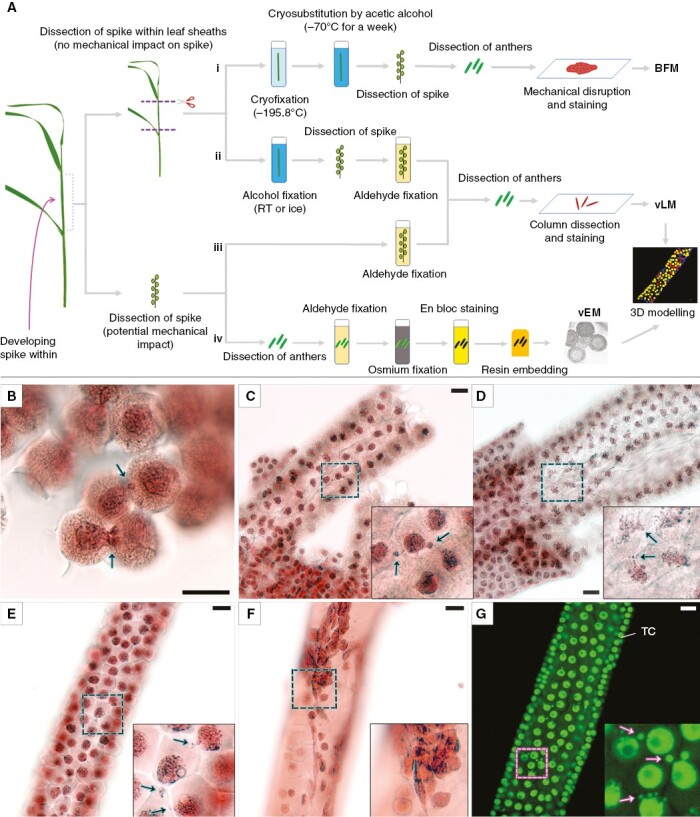
Fig. 1.

Protocols of sample preparation used in this work (i–iv) and resulting images of rye meiocyte columns, as obtained by vLM at early meiotic prophase I. (A) Outline of the experiment. RT, room temperature. (B) Meiocytes after cryofixation were analysed by light microscopy (Ai). (C, D) Meiocyte columns after alcohol fixation were examined by light microscopy (Aii). Column fixed in ice-cold methanol (C) and fixed in acetic alcohol (D). (E–G) Meiocyte columns after aldehyde fixation as examined by light microscopy (Aiii). (E, G) Well-preserved meiocyte columns. (F) Column with damaged meiocytes. Acetocarmine staining and bright-field microscopy (BFM) are shown in (B–F). SYTOX Green staining and confocal laser scanning microscopy (maximum intensity projection) are presented in (G). Arrows point to NPs crossing a cell wall. Boxed regions are magnified in inserts. TC, tapetal cells. Scale bars = 20 µm.
