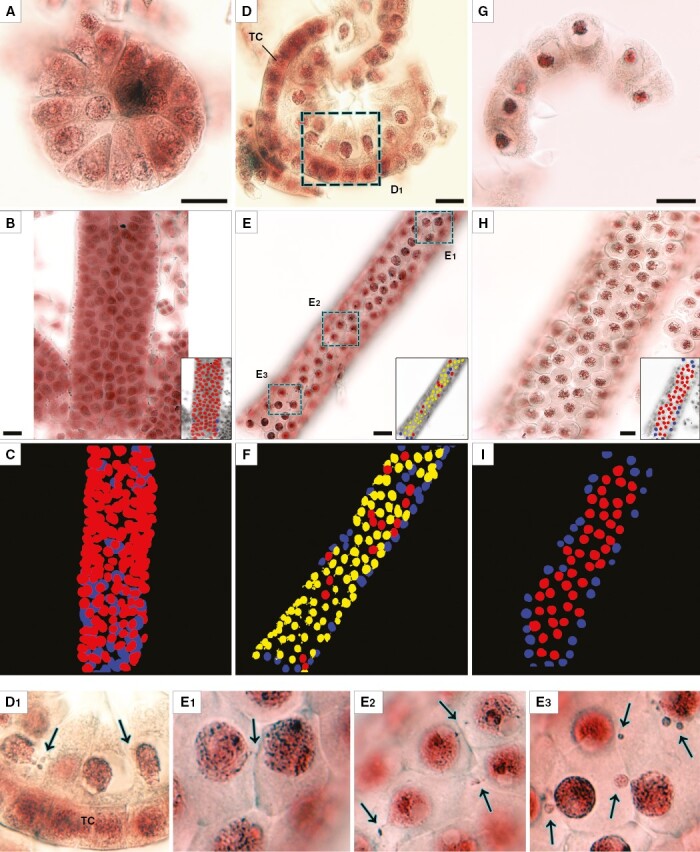
Fig. 2.

Meiocyte columns of rye at the premeiotic stage (A–C), leptotene/zygotene (D–F) and pachytene (G–I) according to light microscopy. (A, D, G) Transverse view of meiocyte columns. (B, E, H) Longitudinal view of a column, represented by an individual optical section from an image stack containing 23 images in (B), 18 in (E) and 11 in (H). In the insets, the same individual images are grey-scaled with manually painted nuclei. (C, F, I) 3-D reconstructions of scanned meiocyte columns with painted nuclei. (D1) and (E1–3) are enlarged fragments. Alcohol fixation in (A, D, G), and formaldehyde fixation in other panels. The yellow colour denotes migrating nuclei, red non-migrating nuclei, and blue partially scanned nuclei (their status is not clear). Arrows point to NPs crossing a cell wall. TC, tapetal cells. Scale bars = 20 µm.
