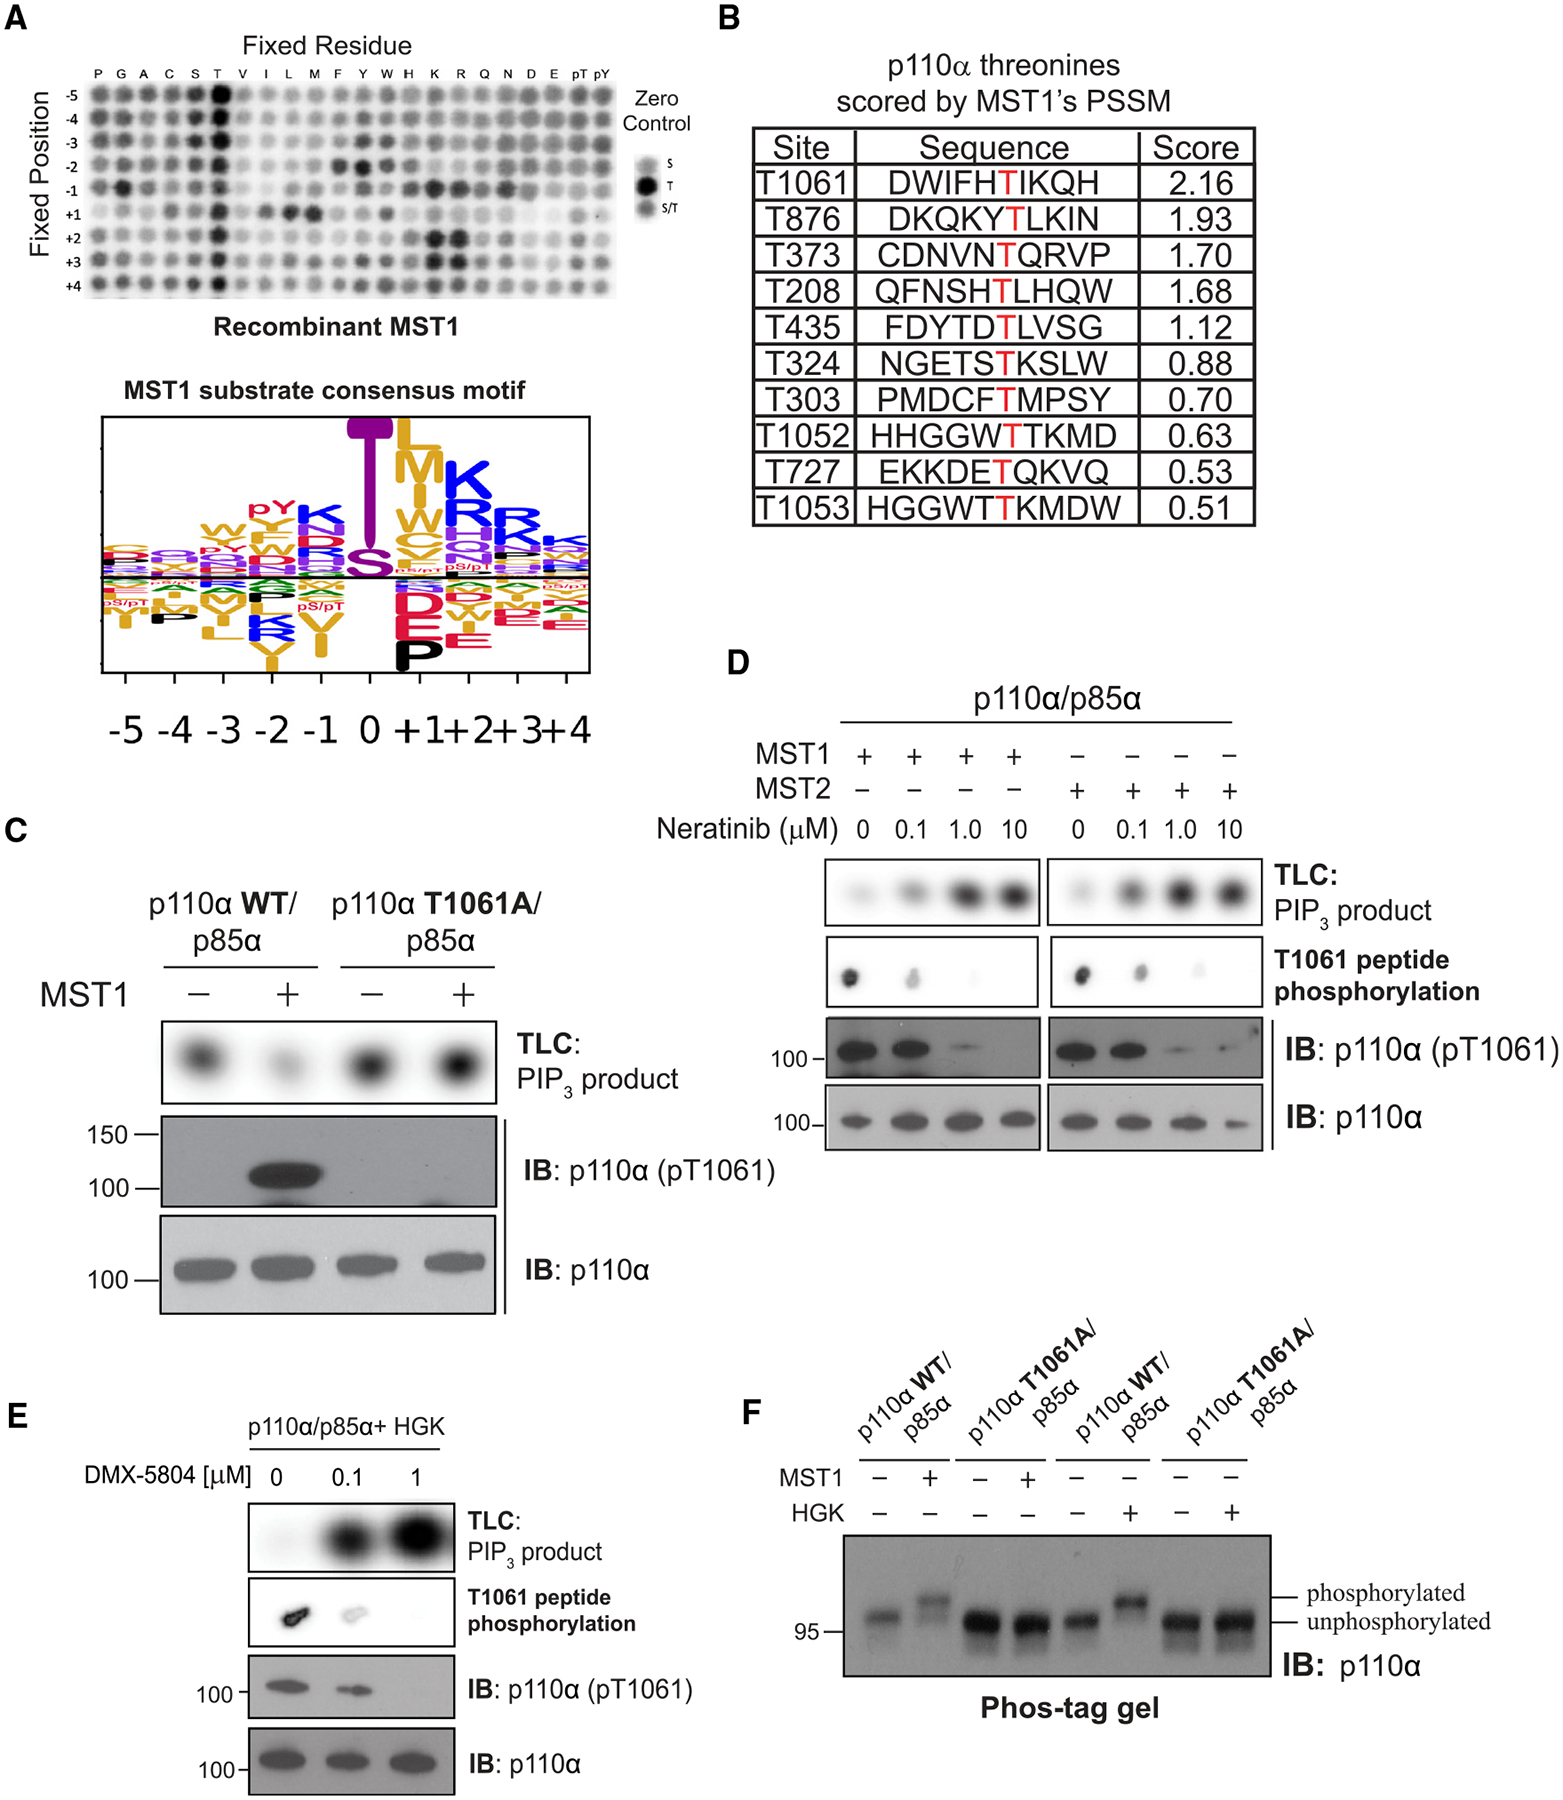
Figure 2. MST1/2 and HGK inhibit catalytic activity of p110α through phosphorylation at T1061.

(A) (Top) Peptide phosphorylation by MST1 to characterize its substrate consensus motif. Positional scanning peptide arrays were utilized, where 22 residues (20 amino acids +2 PTM residues) were scanned across nine neighboring positions of the phospho-acceptor. The zero controls (right inset), consisting of serine only, threonine only, or a 1:1 mixture of both, were examined as phospho-acceptors. Phosphorylation was measured by autoradiography. (Bottom) Sequence logo of the substrate consensus motif of MST1 as determined on top. Letter height is proportional to favorability of corresponding amino acid.
(B) p110α’s threonine residues scored by MST1’s position-specific scoring matrix obtained from (A).
(C) Incubation of p110α(WT)/p85α and p110α(T1061A)/p85α with MST1. Top: autoradiography of [32P]PIP3 production by p110α. Bottom: immunoblots of total p110α and pT1061 p110α.
(D) Incubation of MST1 or MST2 with increasing concentrations of neratinib, followed by incubation with PI3Kα. Top: autoradiography of [32P]PIP3 production by p110α. Second from top: autoradiography of T1061-modeled peptide substrate peptide phosphorylation by MST1 or MST2. Bottom: immunoblots of total p110α and pT1061.
(E) Repeat of (D) using HGK and its specific inhibitor, DMX-5804.
(F) Immunoblot of p110α (WT and T1061A) on Phos-tag gel after treatment with MST1 or HGK.
(A)–(F) are representative of two independent replicates.
