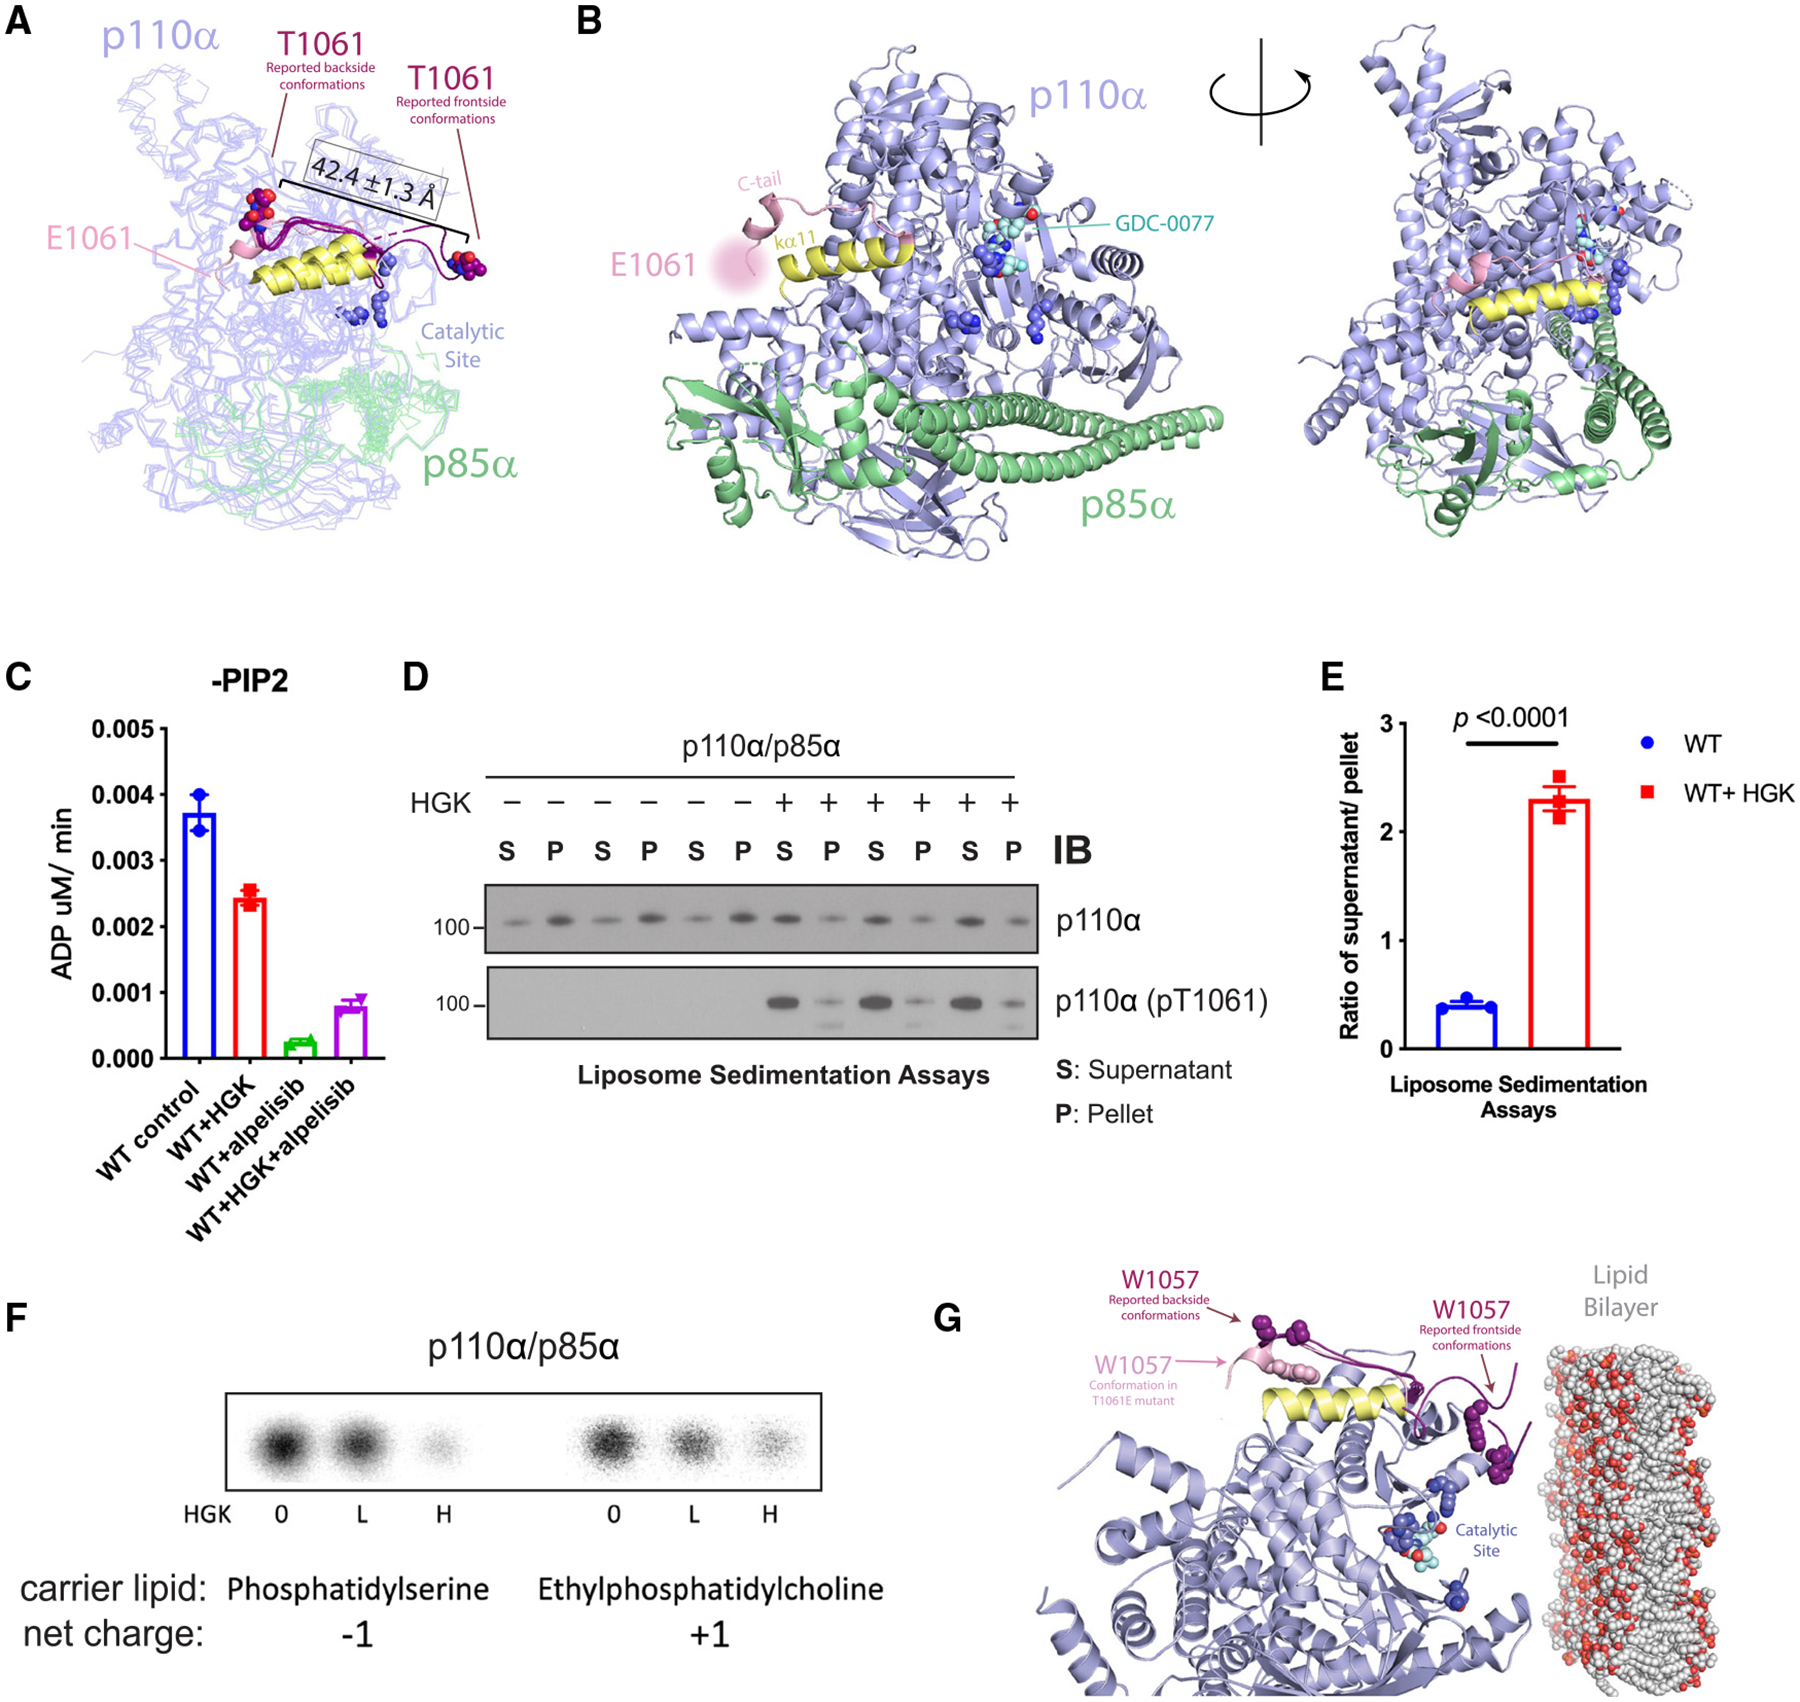
Figure 3. Phosphorylation at T1061 decreases p110α’s association with membranes.

(A) Overlay of the crystal structure of p110α (T1061E) with six reported p110α (WT) structures where threonine 1061 was resolved. C-tails from frontside conformations (PDB: 4A55 and 5DXH) and backside conformations (PDB: 4JPS, 4AWF, 4ZOP, and 5FI4) of reported structures are shown in purple. E1061’s approximate location is indicated. Residues 1032–1048, constituting helix ka11, are displayed in yellow.
(B) Catalytic residue side chains K776, H917, and H93635 are displayed as dark blue spheres.
(C) ADP-Glo measurements of ATPase activity of PI3Kα ± HGK and ± 1 μM alpelisib.
(D) Liposome sedimentation assays of PI3Kα ± HGK, shown as immunoblots of p110α or p110α (pT1061) recovered from membrane-enriched pellet (P) and supernatant (S).
(E) Quantification of densitometries from (D) as ratios of p110α or pT1061 recovery from supernatant over pellet. Data are represented as means ± SEMs. Significance was calculated using Student’s t test (N = 3).
(F) Activity assays of PI3Kα on PI in anionic and cationic liposomes after incubation with HGK. [32P]PIP3 products were resolved by TLC and measured by autoradiography.
(G) Overlay of p110α (T1061E)’s crystal structure (C-tail in pink) with the 6 reported p110α(WT) structures (in purple, C-tails shown only) selected in Figure 2C. The coloring scheme corresponds to Figure 2C. W1057 side chains are represented as spheres. Catalytic site is indicated by residues K776, H917, and H936 (dark blue) and bound GDC-0077 (teal), shown as spheres. The phospholipid membrane model was obtained from RCSB PDB (PDB: 2MLR).
(F) is representative of two independent replicates.
