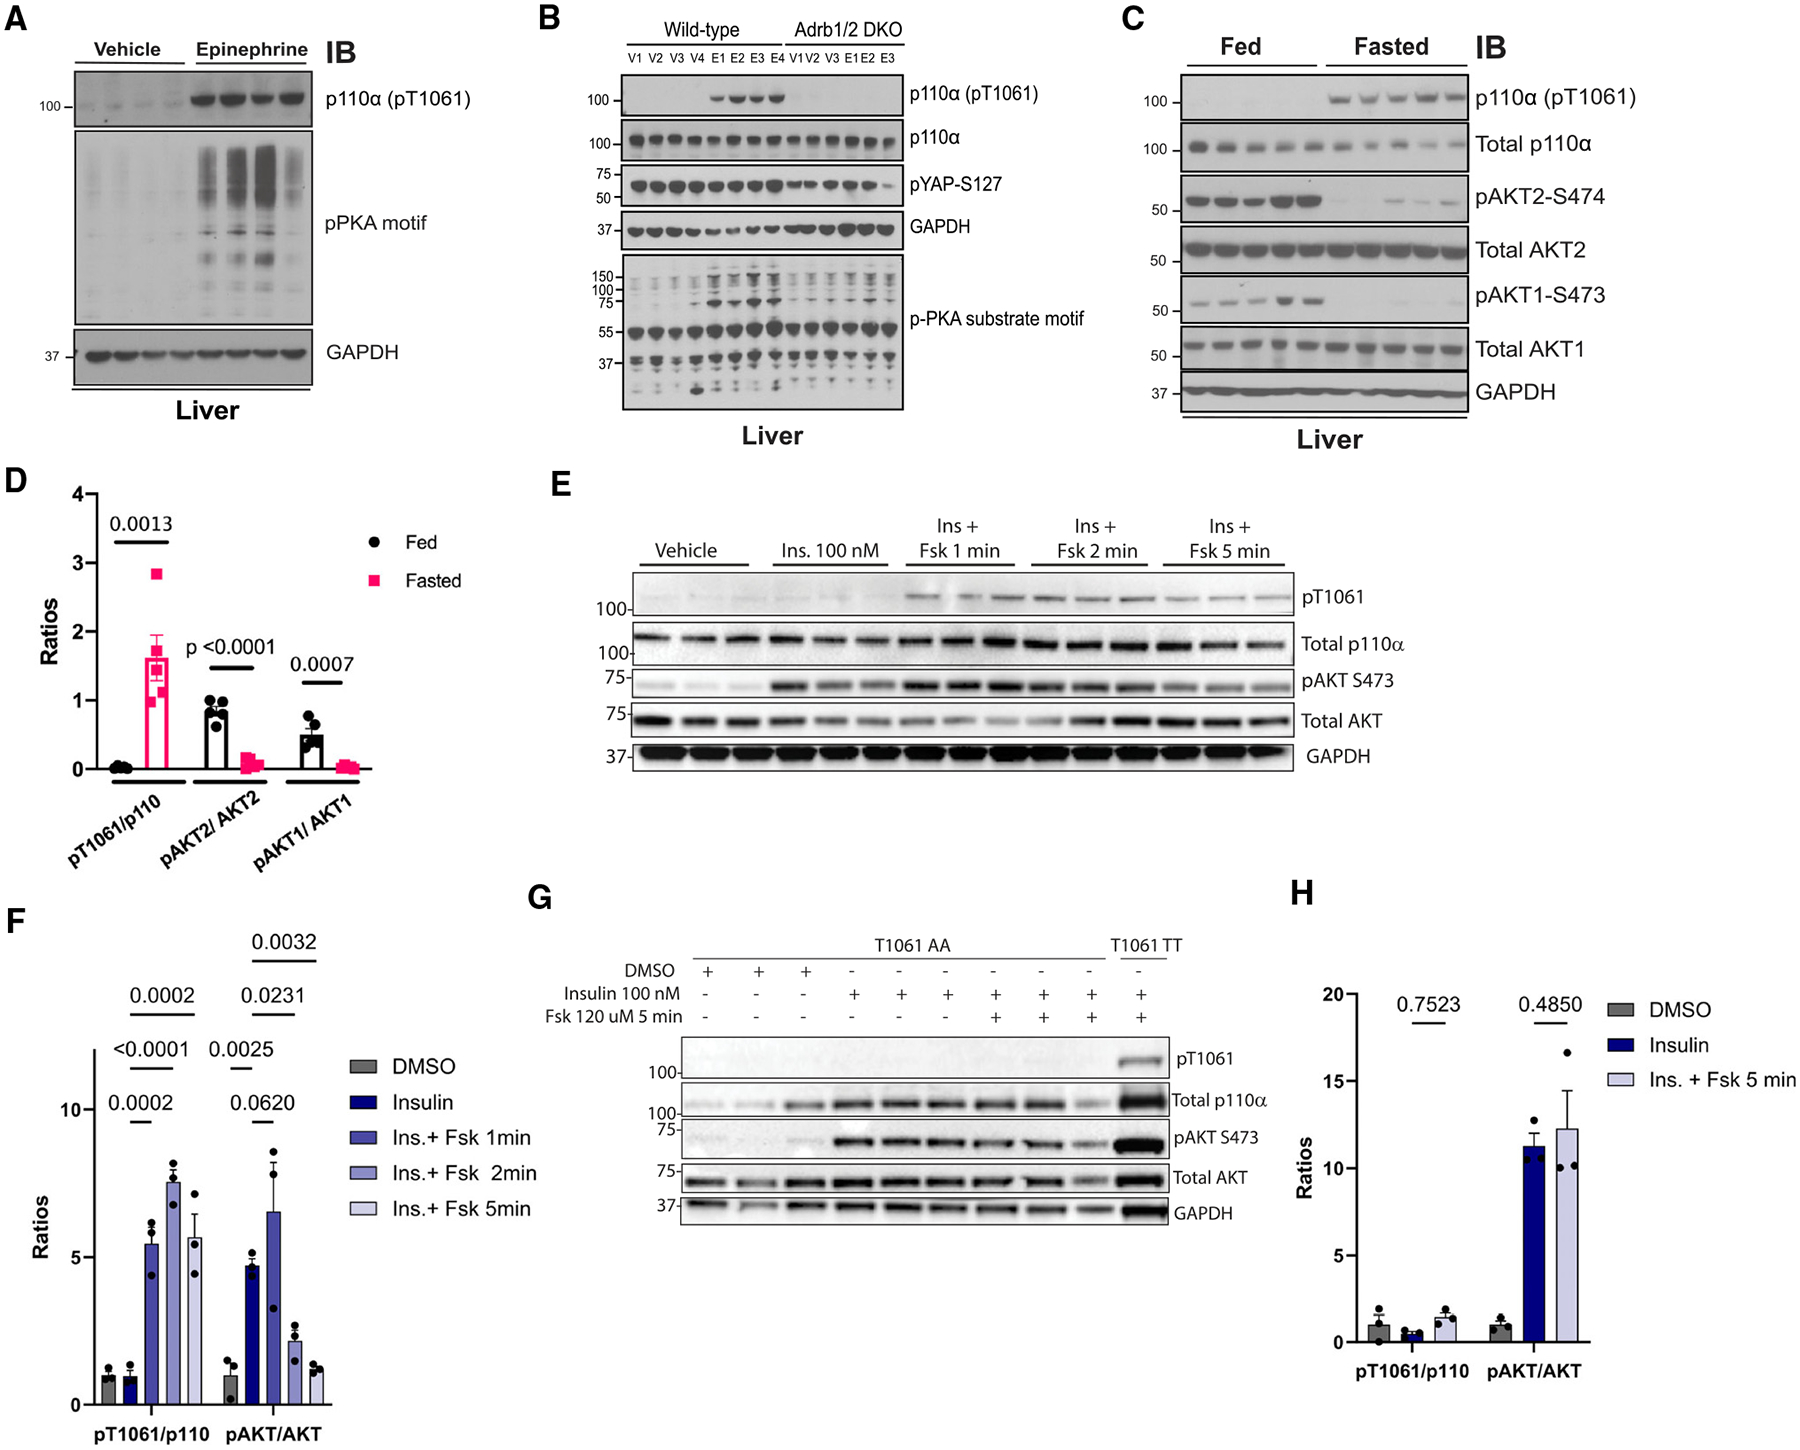
Figure 5. Epi exposure induces phosphorylation and inhibition of p110α in the liver.

(A) Immunoblot for the indicated proteins using lysates from livers taken from WT mice that were injected with vehicle (normal saline) or Epi (0.3 μg/g) for 10 min (n = 4).
(B) Immunoblot for the indicated proteins using lysates from livers taken from WT and β1/β2 double-knockout mice (Adrb1/2 DKO) treated with vehicle (V; saline) or Epi (E) via i.p. injection for 10 min.
(C) Immunoblot for the indicated proteins using lysates from liver taken from WT mice that were fasted for 18 h (Fasted) or fasted and then exposed for food for 4 h (Fed) (n = 5).
(D) Quantification of the ratios of pT1061 to total p110α, pAKT2 to total AKT2, and pAKT1 to total AKT1 using band intensity from (C). N = 5. Comparisons made via ANOVA with Dunnett’s post-test.
(E) Immunoblot for the indicated proteins using lysates from WT mouse primary hepatocytes exposed to vehicle (DMSO), insulin (Ins.; 100 nM), or insulin plus Fsk for the indicated times.
(F) Quantification of the ratios of pT1061 to total p110α and pAKT to total AKT using band intensity from (E). N = 3. Comparisons made via ANOVA with Dunnett’s post-test comparing to insulin group.
(G) Immunoblot for the indicated proteins using lysates from mouse primary hepatocytes isolated from Pik3caT1061A/T1061A mice (T1061 AA, N = 3) or WT littermates (T1061 TT, N = 1) exposed to insulin and Fsk for the indicated times.
(H) Quantification of the ratios of pT1061 to total p110α and pAKT to total AKT using band intensity from (G). N = 3. Data are presented as mean ± SEM. Comparisons made via ANOVA with Dunnett’s post-test comparing to insulin group.
