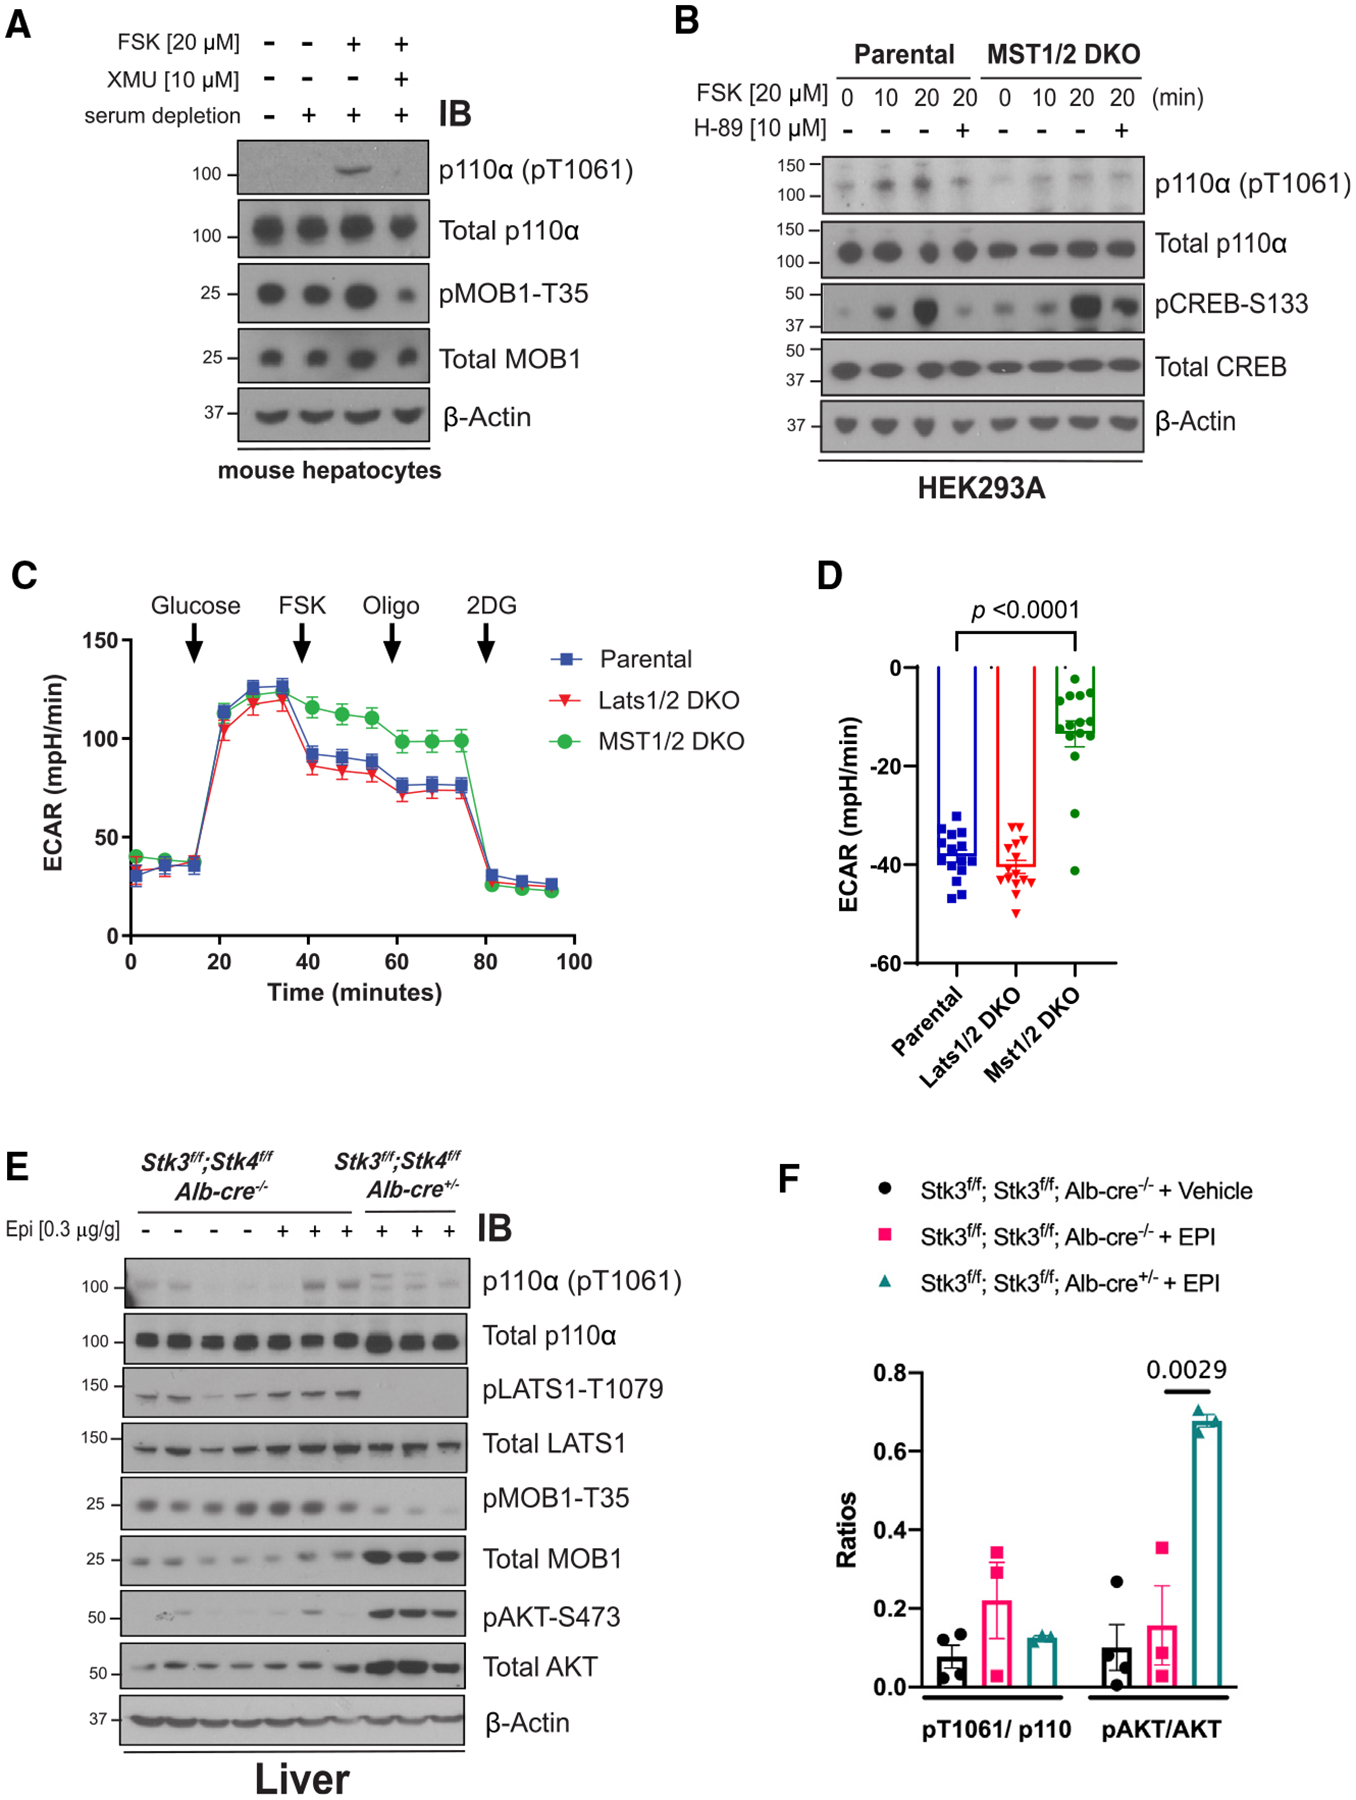
Figure 6. Loss of MST1/2 activity in cells and liver reduces p110α phosphorylation.

(A) Immunoblot for the indicated proteins using lysates from serum starved primary mouse hepatocytes isolated from WT mice that were stimulated with vehicle (DMSO), FSK (20 μM), or FSK and the MST1/2 inhibitor XMU (10 μM).
(B) Immunoblot for the indicated proteins using lysates from HEK293A parental cells or a line with CRISPR deletion of MST1 and MST2 (MST1/2 DKO) that were serum starved for 2 h and pre-treated with vehicle (DMSO) or the PKA inhibitor H-89 (10 μM) for 1 h before stimulating with FSK (20 μM) for 10 or 20 min.
(C) The ECAR was monitored in HEK293A parental, MST1/2 DKO, and Last1DKO cells for 1 h. Arrows indicate injection of glucose (10 mM), FSK (20 μM), Oligo (1 μM), and 2DG (50 mM). N = 15 wells. Results are representative of 3 independent experiments.
(D) The suppression (%) of ECAR following the addition of FSK (20 μM) using data from (C). N = 15.
(E) Immunoblot for the indicated proteins using lysates from livers taken from animals (Stk3f/f;Stk4f/f, Alb-Cre−/− and Stk3f/f;Stk4f/f, Alb-Cre+/−) that were injected with vehicle (normal saline) or Epi (0.3 μg/g).
(F) Quantification of the ratios of pT1061 to total p110α and pAKT to total AKT using band intensity from (E). In (C), (D), and (F) data are represented as mean ± SEMs. Comparisons made via two-way ANOVA with Sidak’s multiple comparisons post-test (D) and ANOVA with Turkey’s multiple comparisons post-test (F).
