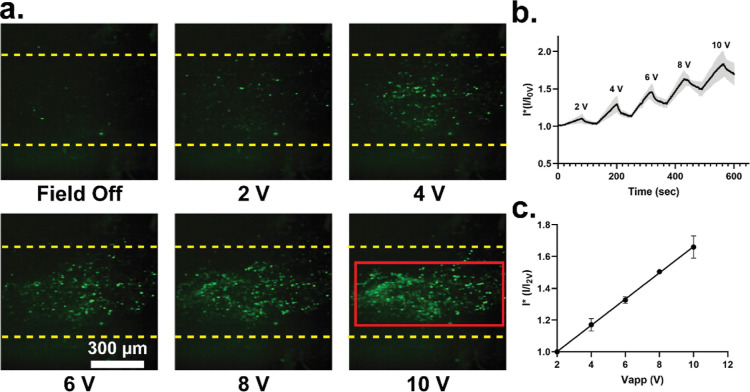
Figure 5.
DEP particle trapping of fluorescently labeled PS particles with a PDC field. (A) Micrographs of paper DEP particle trapping at different applied PDC voltages. (B) Particle capture and release dynamics show clear drop in trapped particles when PDC field removed. (C) Maximum fluorescent intensity determined over varying PDC voltages (one standard deviation error bar, n = 5 fluorescent measurement for each data point).

