FIGURE 3.

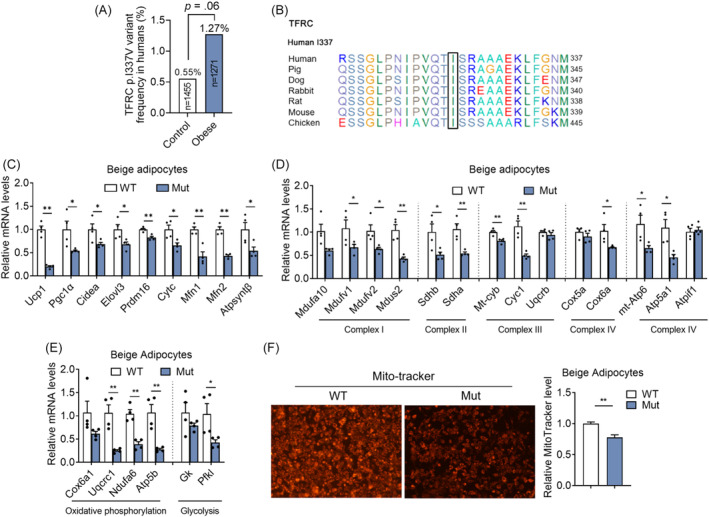
The correlation of transferrin receptor (TFRC) with human obesity. (A) Comparison of the frequency of the TFRC rare variants in control subjects and obese patients. (B) Sequence conservation analysis of the TFRC orthologs related to variants identified in obese subjects and controls. Mutant sites are shown with black box. (C–E) Gene expression analysis of thermogenic markers (C), mitochondrial respiratory chain complex markers (D), oxidative phosphorylation and glycolytic markers (E) from beige adipocytes overexpressed with wild‐type (WT) or mutant (Mut) TFRC. (F) Mito Tracker staining of mature beige adipocytes overexpressed with wild‐type (WT) or mutant (Mut) TFRC. Data were shown as mean ± SEM and *p < .05, **p < .01 compared to control group. mRNA, messenger RNA; UPC1, uncoupling protein 1.
