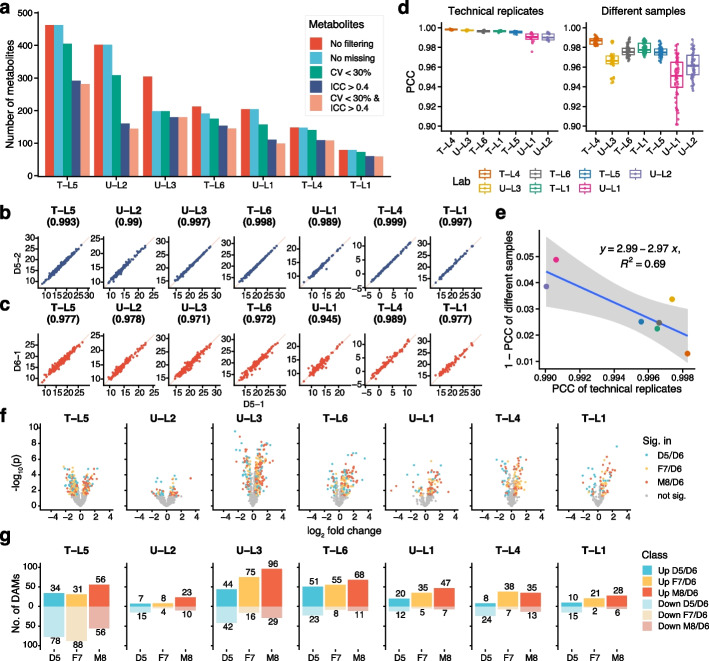
Fig. 2.
High variabilities in the performance of metabolomics profiling among laboratories. a Numbers of detected metabolites in each metabolomic measurement using different filtering criteria, including no filtering (all detected metabolites in any of the samples), no missing (metabolites detected in all 12 samples); CV (coefficient of variance) < 30%; ICC (intraclass correlation coefficient) > 0.04; CV < 30% and ICC > 0.04. b Reprehensive scatter plots of technical replicates (D5-1 and D5-2). c Reprehensive scatter plots of different samples (D5-1 and D6-1). Number in parentheses represent corresponding Pearson correlation coefficient (PCC). d PCC of pairs of technical replicates and of different Quartet samples in each measurement. e Negative correlation between reproducibility (PCC of technical replicates) and discriminability (1-PCC of different samples). f Differentially abundant metabolites (DAMs) analysis for three sample pairs. Volcano plots were used to display the magnitude of the fold change versus the statistical significance level for each measurement. g Numbers of upregulated or downregulated DAMs identified for three sample pairs in each measurement

