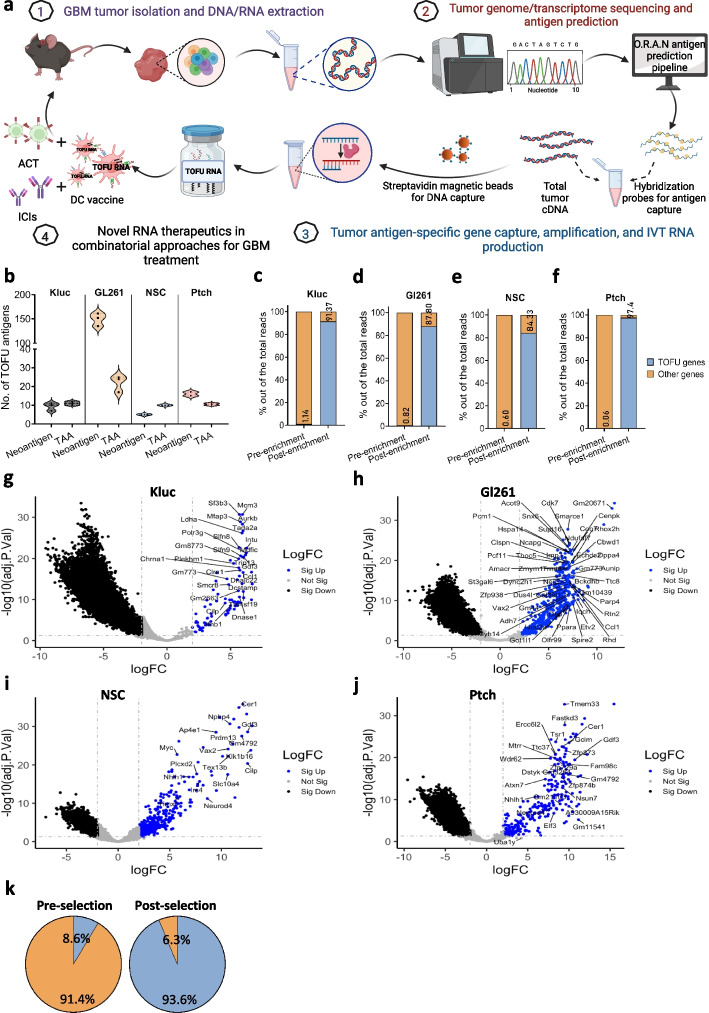
Fig. 1.
Antigen prediction and tumor antigen-specific TOFU mRNA production. a Schematic for tumor antigen-specific TOFU mRNA vaccine development (Created with BioRender.com). b The number of neoantigens or tumor-associated antigens (TAAs) predicted for the KR158-Luc (Kluc), GL261, NSC, and Ptch tumors using the Open Reading Frame Antigen Network (O.R.A.N) pipeline (n = 3 per tumor). c–f Enrichment of tumor antigens in TOFU mRNA libraries as compared to total tumor RNA (ttRNA) for the Kluc (c), GL261 (d), NSC (e), and Ptch (f) tumors. Blue bars represent the % of TOFU genes and orange represents all other genes in the pool. g–j Volcano plots demonstrate the fold change increase in the expression of the TOFU antigens following enrichment in Kluc (g), GL261 (h), NSC (i), and Ptch (j) tumors. TOFU antigens are highlighted and labeled in each plot for all 4 models respectively. k Pie-chart showing enrichment efficiency of tumor-specific and associated genes (316 genes that were selected using differential gene expression and non-synonymous SNVs) from a human GBM patient’s tumor RNA sample. TOFU gene representation is shown in blue and other genes are in orange

