Fig. 7.
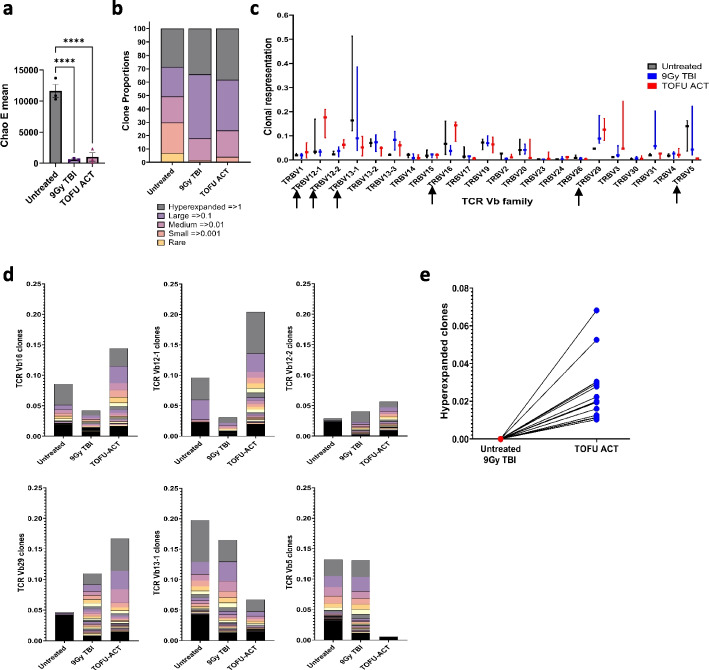
T-cell receptor sequencing following the TOFU-ACT treatment. a Chao E mean score analysis for determining the clonal diversity of T-cells (n = 3 per group). Statistical analysis was performed using Kruskal–Wallis and Dunn’s test for multiple comparisons; p < 0.05 is *, p < 0.01 is **, p < 0.001 is ***, and p < 0.0001 is ****. b T-cell receptor repertoire and clonal expansion using TCR-seq analysis (n = 3 per group). The distribution of clones is shown as hyperexpanded, large, medium, small, and rare based on the expansion of clones and proportion out of the total number of reads. c The expression of TCR Vβ families in the T-cell repertoire of all three treatment groups following therapy. Black arrows show the Vβ families which are either upregulated or downregulated in the TOFU-ACT-treated tumors compared to controls. d The proportion of individual T-cell clones within different TCR Vβ families. e The expression of the individual hyperexpanded clones in the TOFU-ACT treated tumors compared to the untreated and 9 Gy TBI treated tumors

