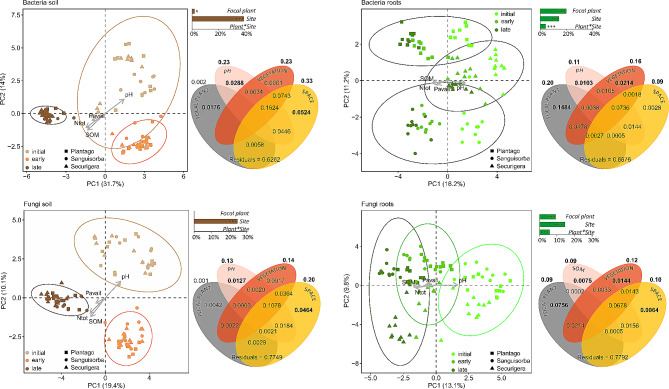
Fig. 3.
Composition of microbiomes in the roots and adjacent soil of Plantago lanceolata, Sanguisorba minor, and Securigera varia across a successional grassland sequence. Principal component analysis (PCA) ordination was calculated on Hellinger-transformed OTU abundances, environmental variables significantly correlated (P < 0.05) with ordination axes were added as vectors using envfit. Bar charts represent PERMANOVA outputs showing the amount of variation (adjusted R2) in the microbiota structure explained by the successional site, focal plant species, and their interaction, Venn diagrams depict the results of variance partitioning analysis. For each testable fraction, an adjusted R2 is given, and significance (P < 0.05) is indicated in bold. The values within the diagrams indicate the amount of variation explained purely by the given fraction, the values above the diagrams indicate the total variance explained by the given fraction, including the effect shared by the fraction and other variables

