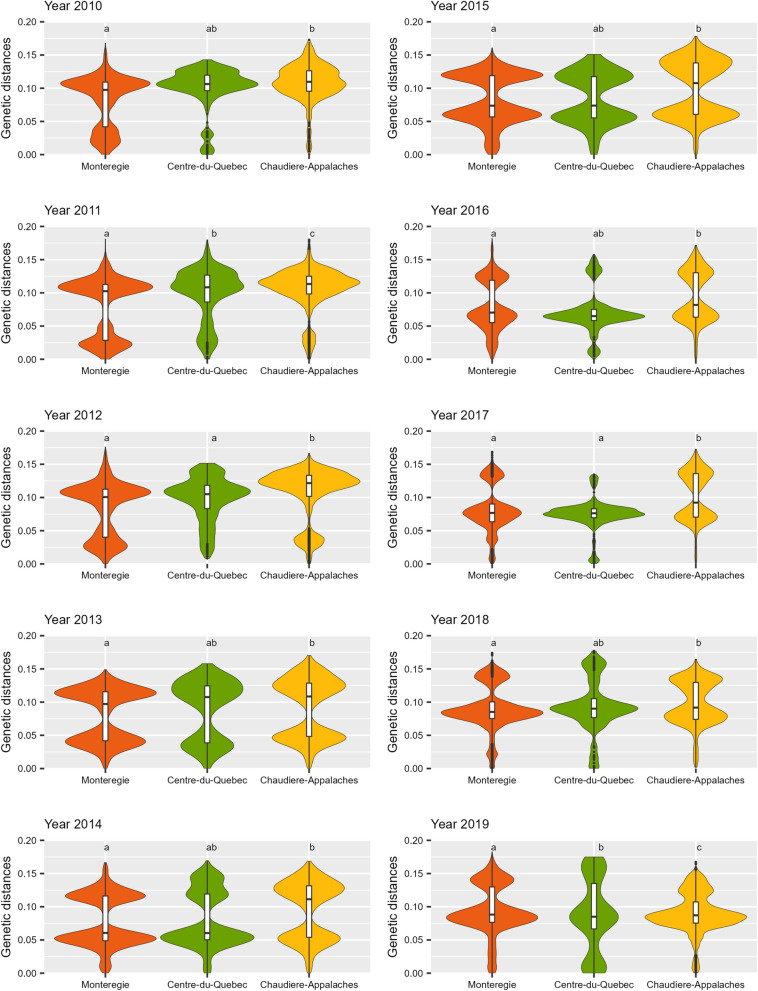
Fig. 7.
Distribution of genetic distances among wild-type sequences in three administrative regions according to year. A total of 2222 wild-type sequences (1 randomly selected per pig site and per year,) submitted between 2010 and 2019 were included. Within a specific year, regions with different letters indicate a significant pairwise difference in genetic diversity from the molecular analysis of variance (AMOVA) (P < 0.002), considering a Bonferroni adjustment for multiple testing. Monteregie, orange; Centre-du-Quebec, green; Chaudiere-Appalache, yellow

