Figure 2.
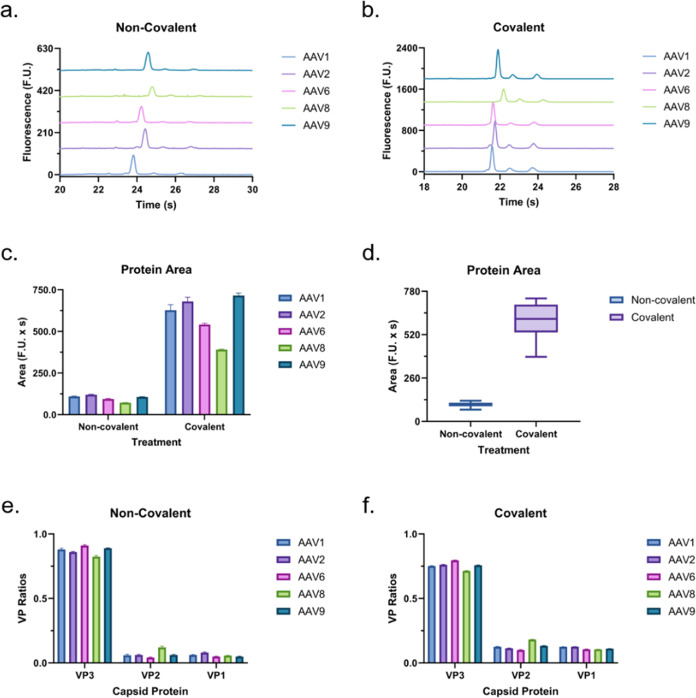
Electrophoretic characterization of the capsid proteins of AAV1, 2, 6, 8, and 9. Electropherograms of the different serotypes using (a) the noncovalent dye with an offset of 130 F.U. and (b) the covalent dye with an offset of 450 F.U. The peak areas for all three capsid proteins are highlighted (c) by serotype and (d) by dye type. Comparing the covalent dye response to the noncovalent, we see a 6-fold increase in peak area. Note that all samples were normalized to 2.5 × 10¹² VG/mL at different percentages of full and are expected to have different capsid concentrations. However, while the concentrations vary across serotypes, they were used at the same concentration in both assays, enabling a direct comparison between the two. Predicted VP ratios using (e) the noncovalent and (f) the covalent assay. The VP ratios were estimated by dividing each peak area by the protein MW (Table S1) and normalizing the values.

