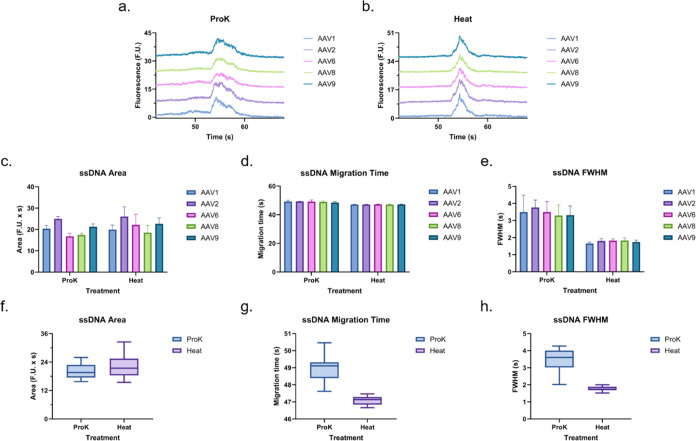
Figure 3.
AAV ssDNA electropherogram profiles post-treatment with (a) proteinase K (proK, electropherograms offset by 8 F.U.) and (b) heat (electropherograms offset by 10 F.U.). Comparison of peak (c) area, (d) migration time, and (e) fwhm using each treatment separated by serotype. Average peak (f) area, (g) migration time, and (h) fwhm for each treatment.

