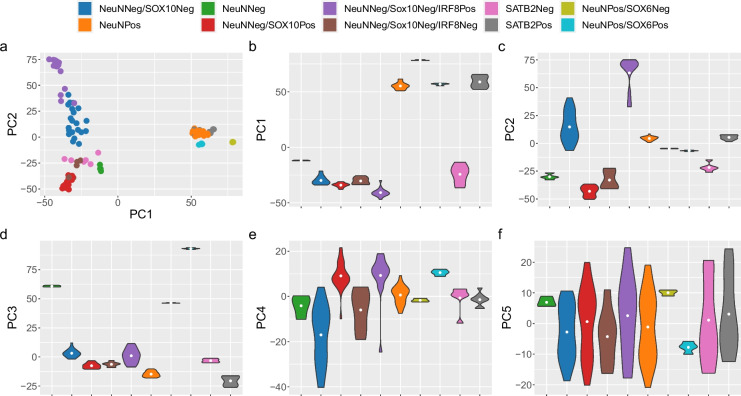
Fig. 1.
Major axes of variation in DNA methylation data are driven by cell type. Scatterplot (a) of the first two principal components where each point represents a sample (n = 123 samples from 47 donors) and the colour of the point indicates the nuclei fraction. Violin plots for the first 5 principal components (b–f) grouped by nuclei fraction (sample sizes can be found in Additional File 2: Supplementary Table 1). DoubleNeg (NeuNNeg/SOX10Neg; n = 21), IRF8Pos (NeuNNeg/SOX10Neg/IRF8Pos; n = 17), NeuNNeg (NeuNNeg; n = 4), NeuNPos (n = 28), SATB2Neg (n = 6), SATB2Pos (n = 9), SOX6Neg (NeuNPos/SOX6Neg; n = 3), SOX6Pos (NeuNPos/SOX6Pos; n = 4), Sox10Pos (NeuNNeg/SOX10Pos; n = 24), TripleNeg (NeuNNeg/SOX10Neg/IRF8Neg; n = 7)

