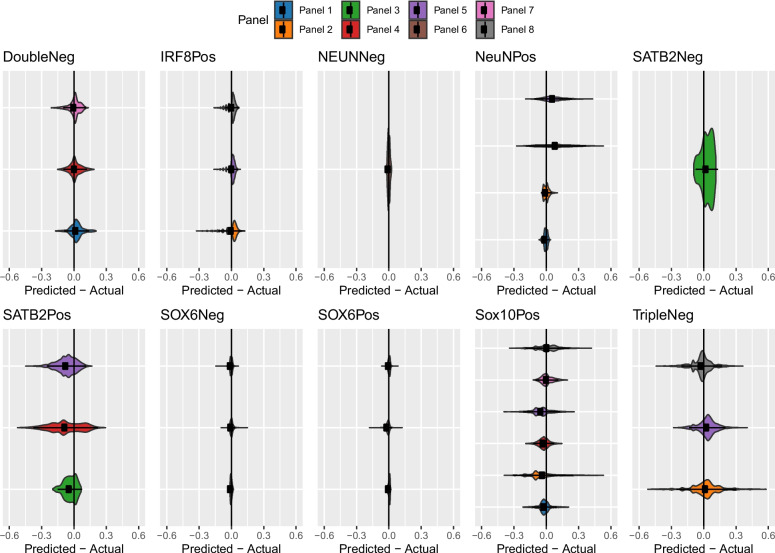
Fig. 3.
Accuracy and bias differs across cell types when estimating the cellular composition of the cortex. Violin plots of the error associated with estimating the cellular proportions of reconstructed cortical brain profiles, measured as the difference between predicted and actual abundance, where a positive value indicates an overestimation. Panels collate results for the same cell type, within each panel, values are grouped by reference panels, as defined in Table 1. For each reference panel reconstructed cortical profiles were generated to capture the full spectrum of cellular heterogeneity (n = 90–1260)

