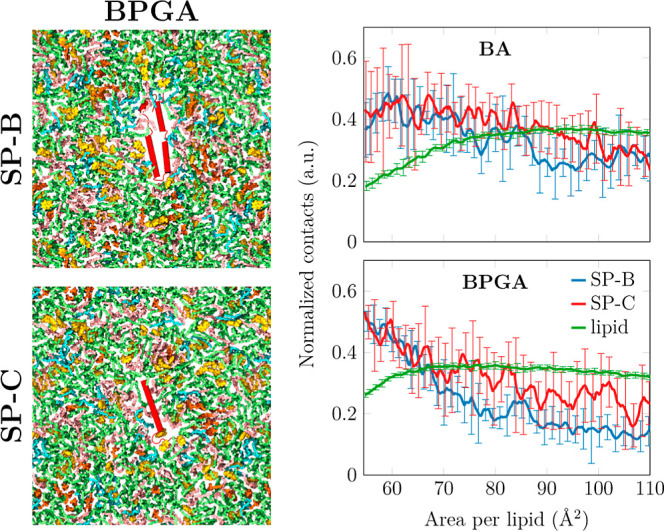
Figure 5.

Interaction of vaping chemicals with hydrophobic surfactant proteins SP-B and SP-C. Left: Snapshots of the simulation system containing one copy of either SP-B (top) or SP-C (bottom). The simulations shown also contain BPGA, shown in yellow. Proteins are colored red, DPPC green, POPC pink, POPG blue, and cholesterol in orange. Hydrogens and water are omitted for clarity. Right: Interactions of BA and BPGA with the surfactant lipids and proteins as a function of the monolayer area. The contact numbers are normalized by the number of possible interactions in the two groups included in the analyses. For lipids, only the curve from the simulation containing SP-B is shown since the result with SP-C is essentially identical. The error bars show the difference between the data calculated from the two replica simulations.
