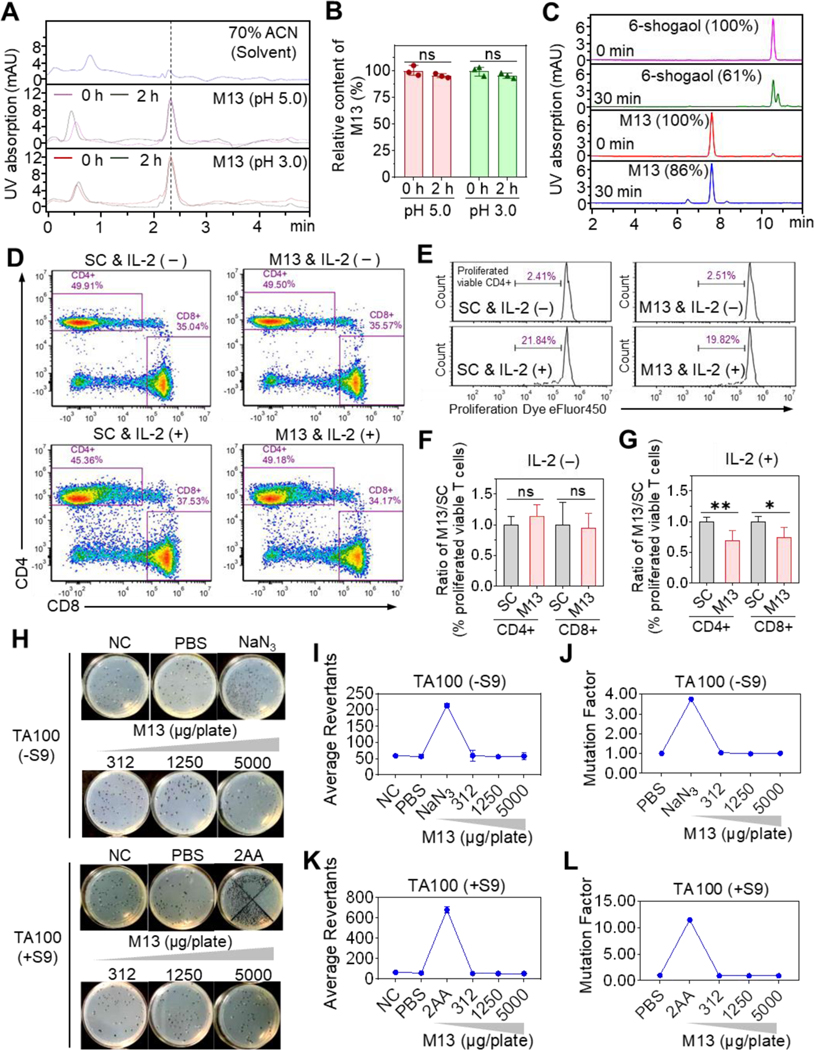
Figure 1. M13 presents excellent biopharmaceutical properties.
(A) HPLC profile of M13 in acidic PBS. (B) Relative M13 content before and after incubation (n = 3). (C) Relative content of M13 or 6-shogaol (determined by HPLC) before and after incubation with mouse intestinal microsomes (n = 3). (D) FACS of cultured PBMCs with gating on viable CD4+ and CD8+ T cells in the solvent control (SC) and M13-treated groups with (+) or without (-) IL-2 addition. (E) Percentage of viable proliferating CD4+ T cells. (F-G) M13-treated-to-SC group ratio of the percentage of proliferating viable T cells with or without IL-2 addition (n=3). (H-L) Representative plate photos (H), colony average revertant numbers (I and K), and mutational factors (J and L) of the Ames test using S. typhimurium strain TA100 with (+S9) or without (-S9) metabolic activation (n = 3). Negative control (NC), no treatment; PBS, vehicle control; NaN3, (1 μg/plate), positive control; 2AA, (2-aminoanthracene, 2 μg/plate), positive control. (ns, not significant; *p < 0.05, **p < 0.01).

