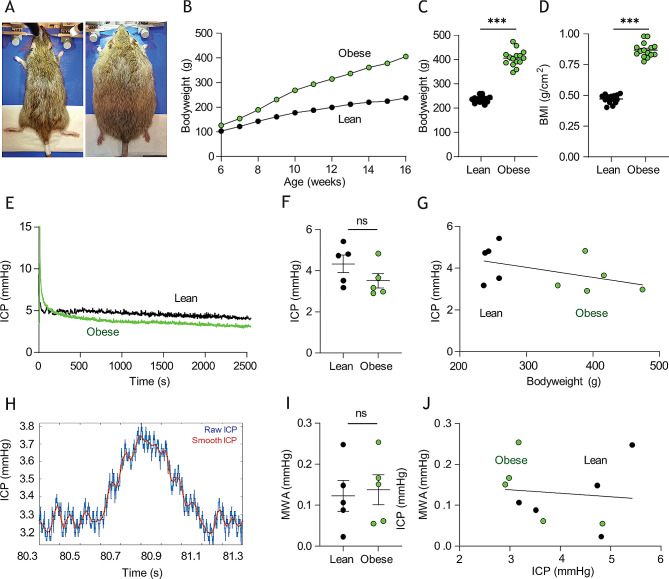
Fig. 1.
Zucker rat bodyweight and intracranial pressure. A Images of lean (left panel) and obese (right panel) Zucker rats. B Bodyweight increases as a function of time of Zucker lean (n = 15) and obese (n = 16) rats included in study. Error bars are within the symbols. C Rat bodyweight and D body mass index (BMI) at time of experimentation. E representative intracranial pressure (ICP) traces from Zucker lean and obese rats with the final 15 min recordings quantified in F, n = 5 of each. G Correlation analysis of ICP as a function of bodyweight in the tested Zucker rats. H Representative ICP trace with “raw” (blue line) and “smoothed” (red line) signals, the latter used to calculate the mean wave amplitude (MWA), represented in I (n = 5 of each). J Correlation analysis of MWA as a function of ICP, n = 10. Statistical significance evaluated with Student’s unpaired t-test or simple linear regression and results shown as mean ± SEM. ***p < 0.001, ns = not significant

