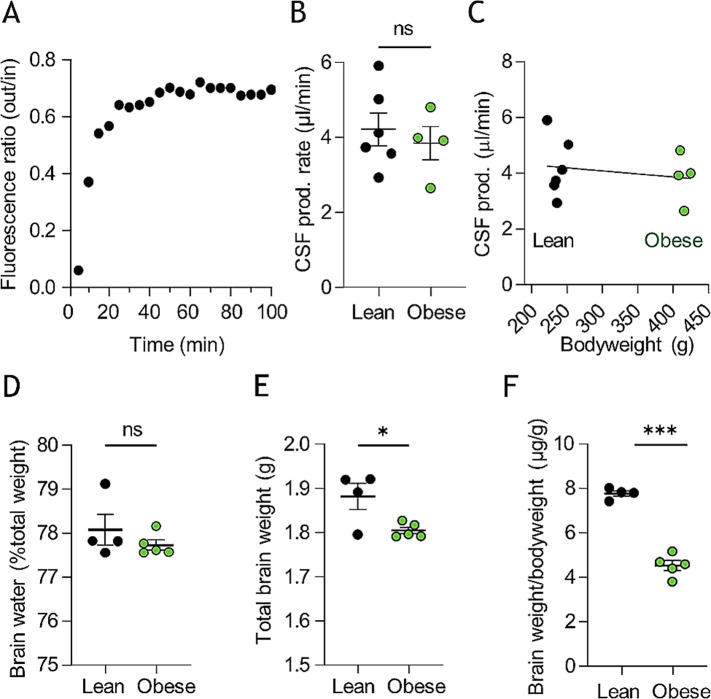
Fig. 2.
Zucker rats CSF production rates and brain water content. A Representative trace of fluorescent dye dilution over the course of a ventriculo-cisternal perfusion assay in a Zucker lean rat with the final 30 min employed for quantification of the CSF production rate illustrated in B, n = 4–6. C illustrates the CSF production rate as a function of bodyweight, with no significant correlation between the two parameters. D percentage brain water content in Zucker lean and obese rats, n = 4–5. E Brain weight and F relative brain weight of lean and obese Zucker rats, n = 4–5. Statistical significance evaluated with Student’s unpaired t-test or simple linear regression and results shown as mean ± SEM. *p < 0.05, ***p < 0.001, ns = not significant

