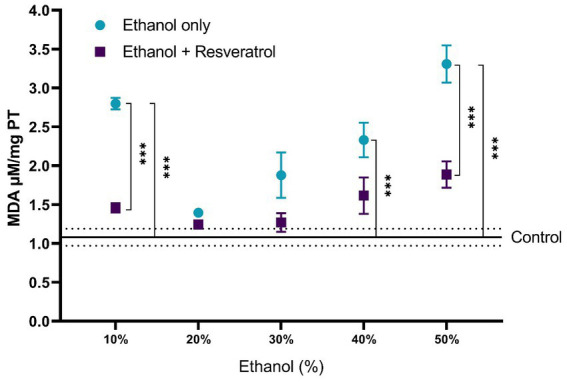
Figure 3.

Antioxidant activity of resveratrol on MDA levels in the hippocampus of rats administered with ethanol and treated with resveratrol. Data are presented as mean ± SE. The straight line is the mean of the control group, and the dotted line is the SE. Comparison is made using a two-way fixed effects ANOVA model, and post-hoc comparison was made using Tukey’s test. *p < 0.05, **p < 0.01, ***p < 0.001.
