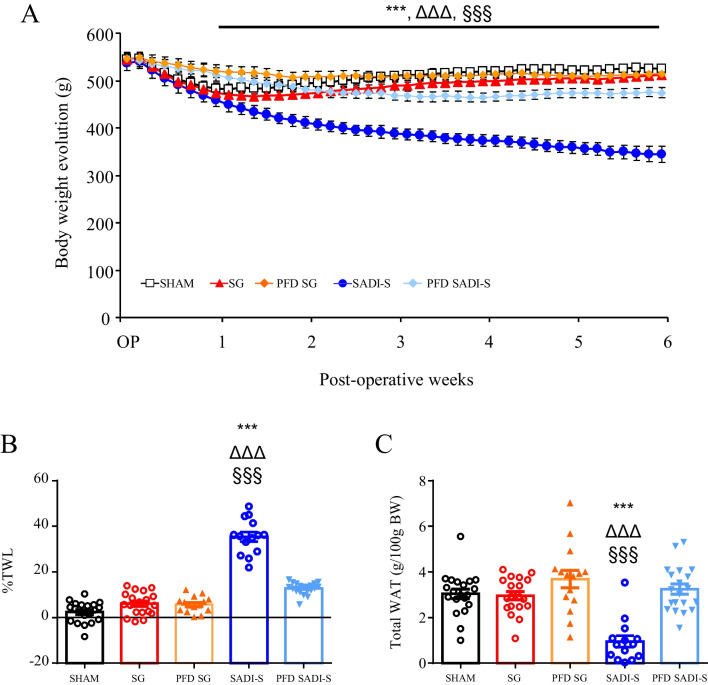
Fig. 2.
The improvement of body weight and adiposity after SADI-S, but not SG, is beyond caloric restriction. A Growth curves of rats 6 weeks after surgical and caloric interventions. Bar graphs illustrate B the total weight loss of the experimental animals and C the total white adipose tissue. Values are the mean ± SEM (n = 15–20/group). Differences were analyzed by one-way ANOVA followed by Bonferroni post hoc tests. ***p < 0.001 vs. sham-operated group; ΔΔΔ p < 0.001 vs. SG group; §§§p < 0.001 vs. PFD SADI-S rats. BW, body weight; FER, food efficiency ratio; PFD, pair-fed; SADI-S, single anastomosis duodeno-ileal bypass with sleeve gastrectomy; SG, sleeve gastrectomy; TWL, total weight loss; AT, white adipose tissue

