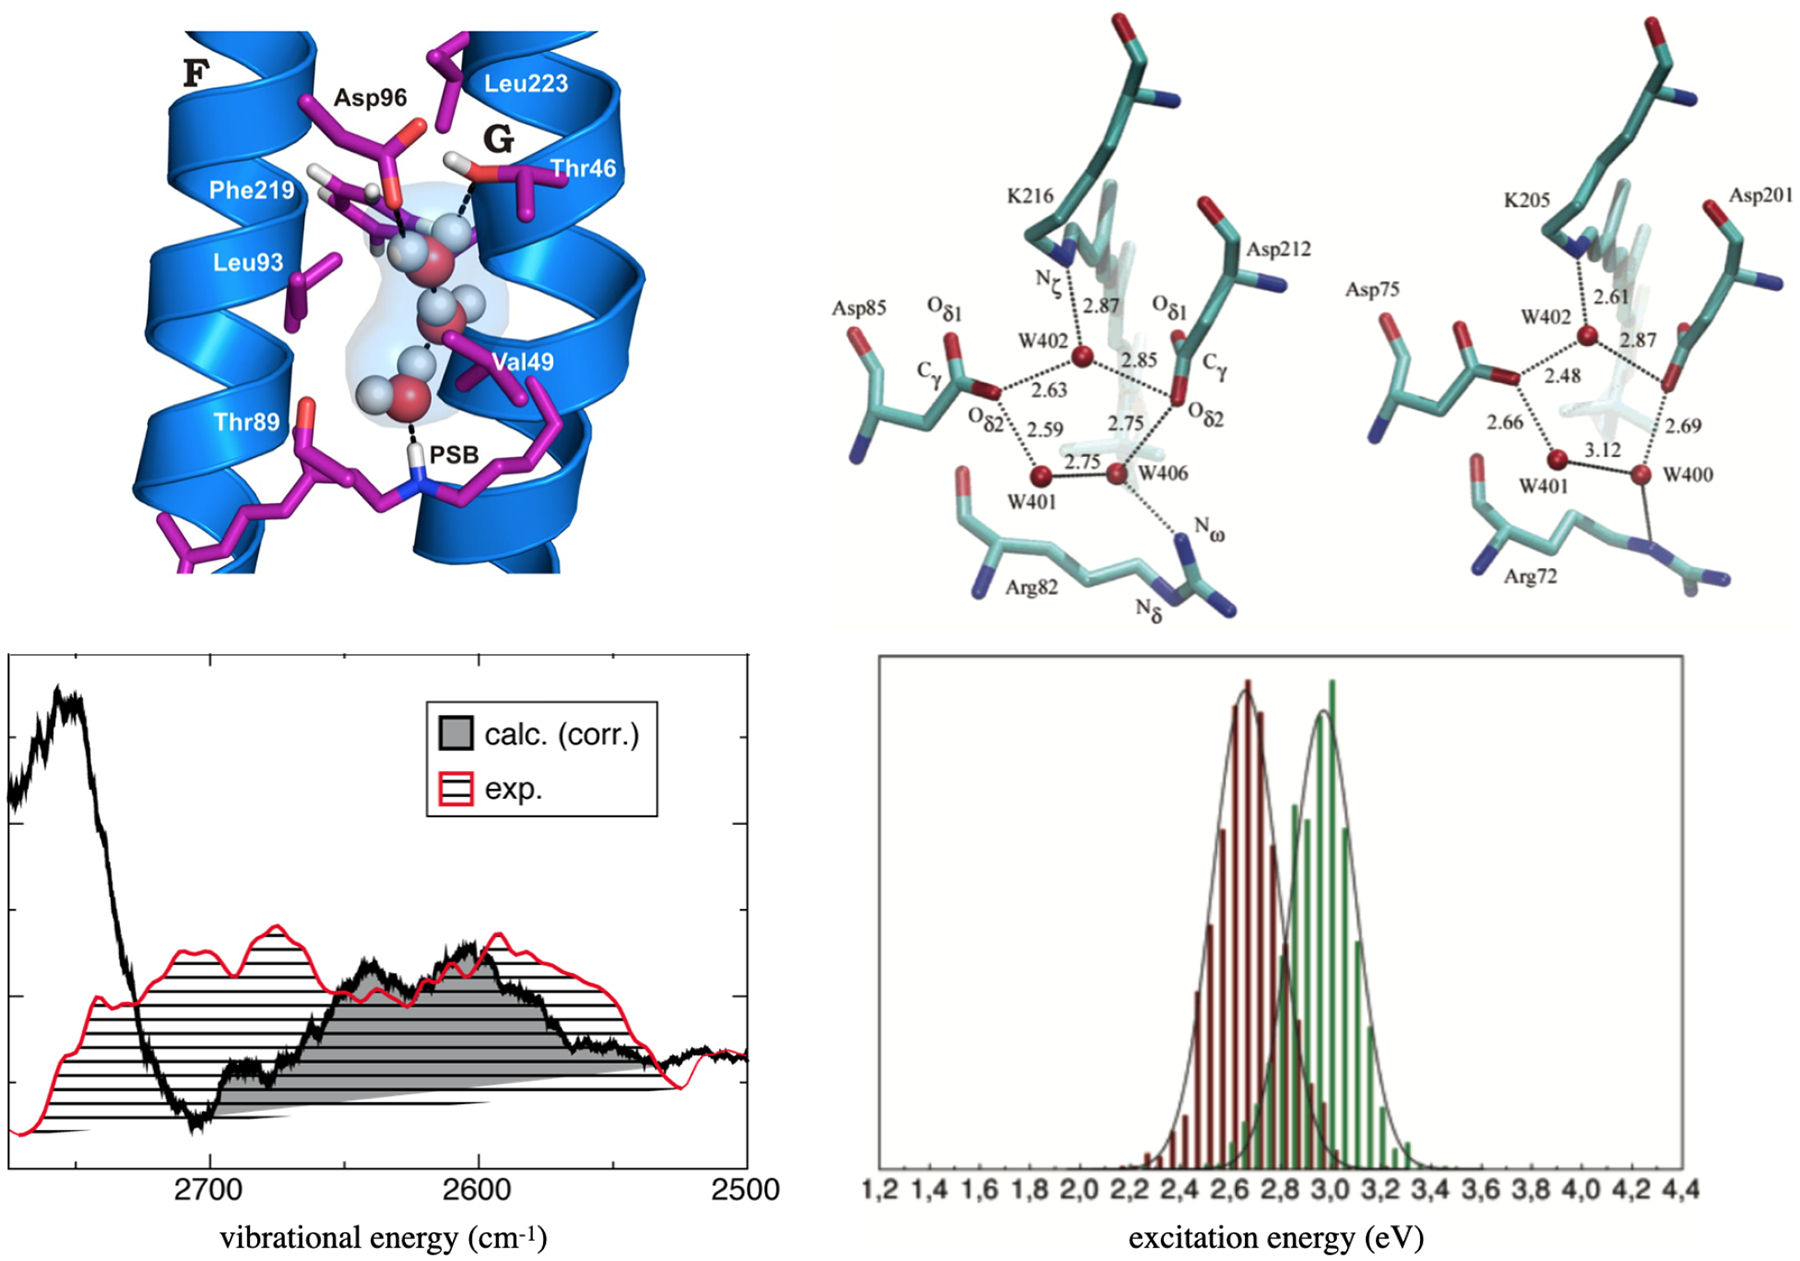
Figure 5:

QM/MM calculations help explain shifts in vibrational and electronic spectra in retinal proteins. Left: A water cluster in the N state of bR has a unique local environment that leads to significant red-shifts of the computed (DFTB3/MM) vibrational spectra, in agreement with experimental observations.120 Right: Difference in the hydrogen-bonding networks in the active sites of bR and ppR lead to significant shifts in the computed S0–S1 transitions: the histograms for bR (red) and ppR (green) are based on OM2/MRCI calculations sampled along ground state classical MD trajectories.134
