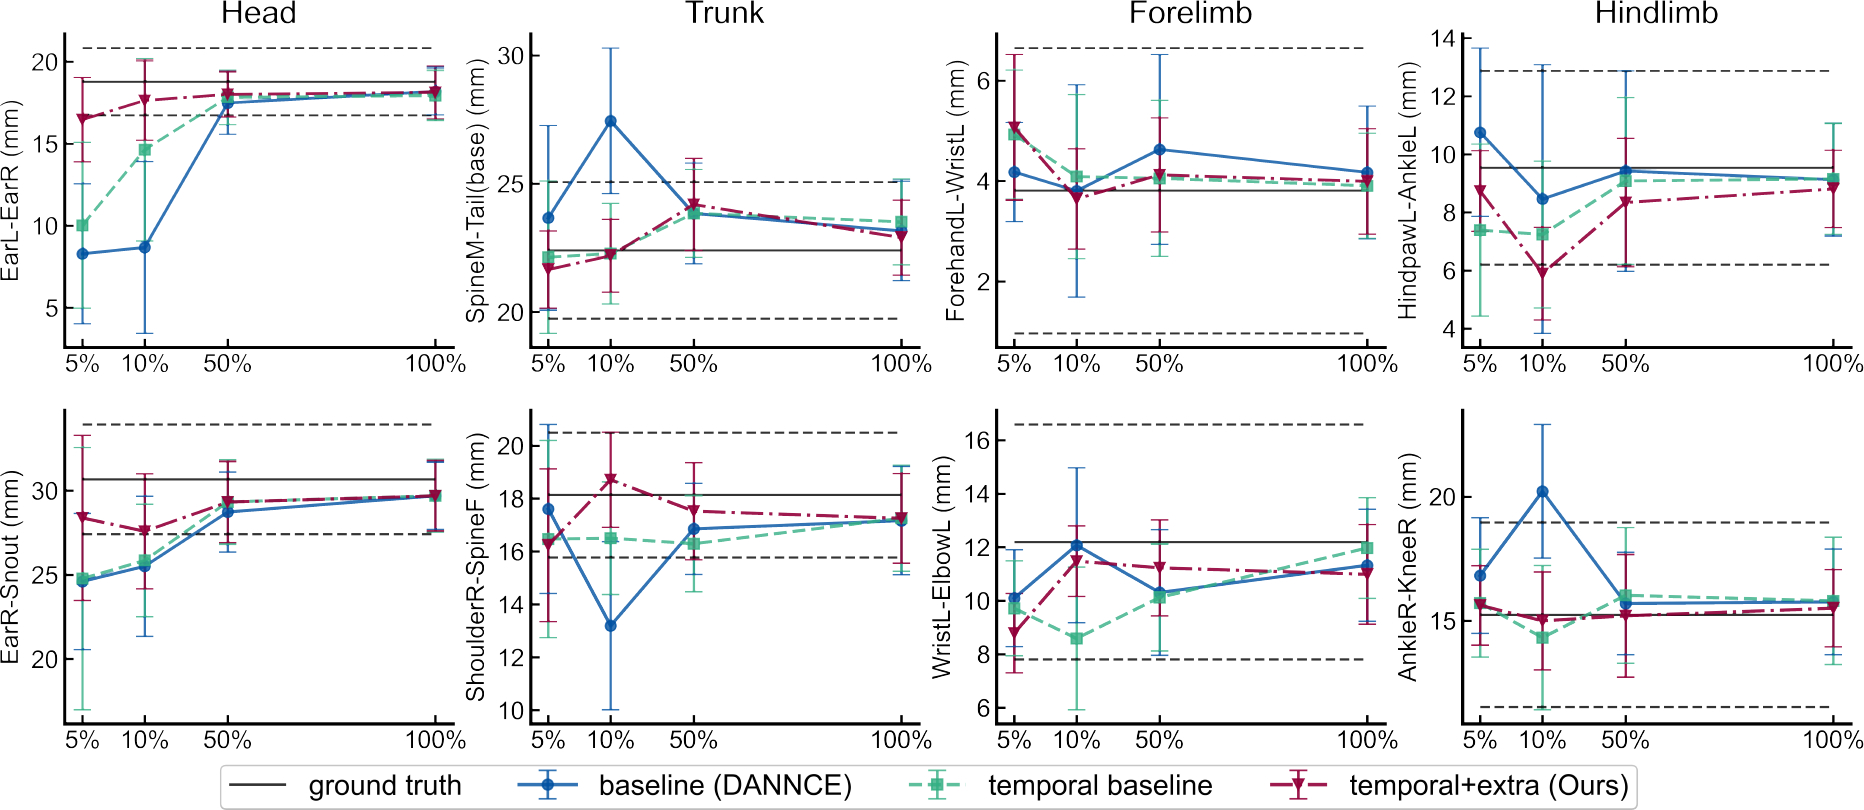
Fig. 5. Body segment length consistency.

Plots reporting the statistics of eight different body segment lengths. The solid black horizontal line in each plot represents the mean body segment length computed from manually labeled ground-truth, and the horizontal dashed lines encompass corresponding standard deviations. Error bars are standard deviation.
