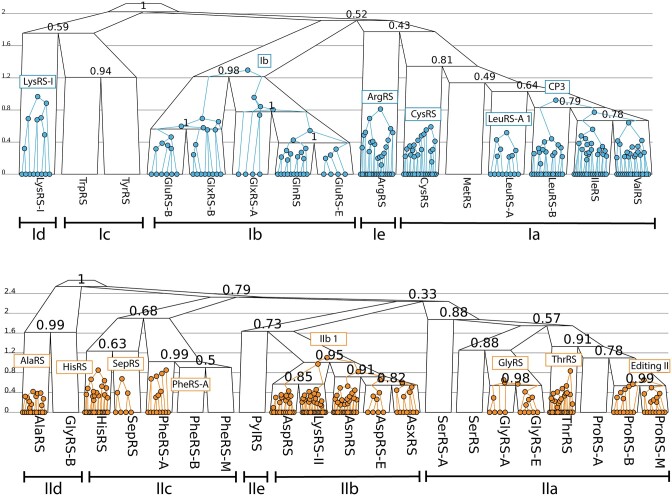
Figure 3.
Phylogenies of Class I (top) and II (bottom) catalytic domains. A selection of module trees (coloured) are displayed within the catalytic domain family trees (black). Family tree internal nodes are labelled by clade posterior support. The y-axes depict the rate of change (amino acid substitutions per site and births/deaths per module, weighted according to their instantaneous rates, (see Supporting information), in contrast to the phylogenies in Supplementary Figures S1–S2 which are expressed in substitutions per site, and show similar heights for Class I and II trees. The remaining insertion modules, omitted from this diagram, are shown in Supplementary Figures S42–S67.

