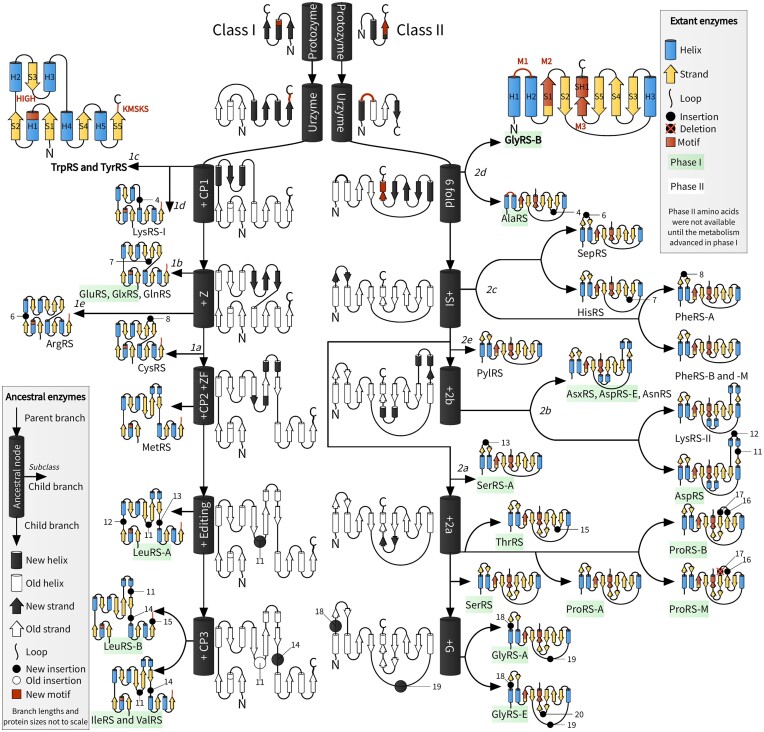
Figure 4.
AARS accretion model. Branching off from the central black-and-white ancestral lineages into extant proteins could have occurred at any time, and hence arrows do not denote the passage of time, but rather evolutionary relationships. The temporal component of this figure is depicted by the phase I and II amino acids, as identified by Wong 2005 (6), where we have assigned Pyl and Sep to phase II. Insertion modules are numbered using the key in Table 1. HIGH and KMSKS are the motifs of Class I, and M1–M3 are the Class II motifs 1–3 (68). Loops may contain other secondary structures (see Figure 1).

