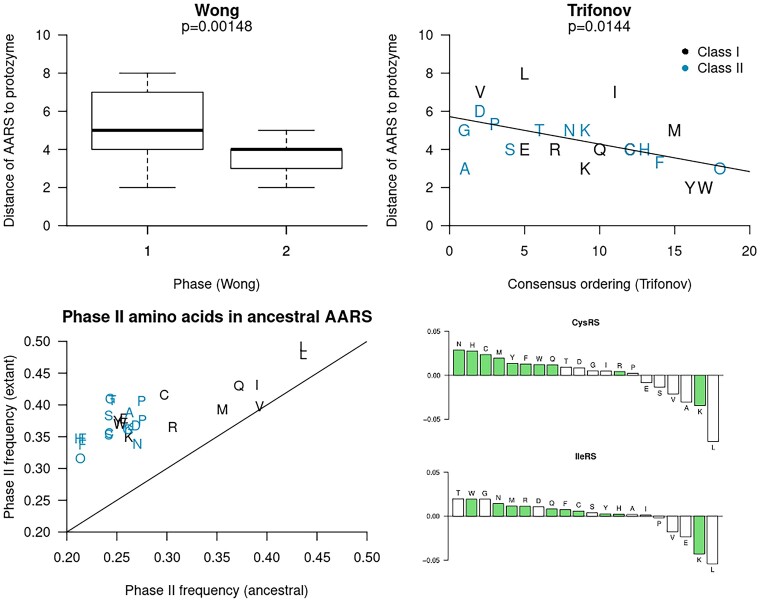
Figure 5.
Top: the distance between each extant AARS and the protozyme, according to Figure 4. This distance is defined as the number of IMs that were inserted to assemble the extant AARS from the protozyme. For example, LeuRS-A has a distance of 8. Top left: the p-value is the result of a one sided Student t-test with a null hypothesis that the phase I and II amino acids (6) are activated by AARS which are equally close to the protozyme (i.e., the same degree of structural primitivity). Top right: the P-value is from a two-sided Pearson test between distance to protozyme and Trifonov’s consensus ordering (5). We note the inclusion of pyrrolysine (O), which was absent from Trifonov’s ordering, but has been assigned here as a latecomer due to its metabolic dependency on lysine (108). These two experiments are consistent with the hypothesis of more recently occurring amino acids being recognised by simpler AARS catalytic domains, particularly for Class I. Bottom: the proportions of phase II amino acids were estimate for the most recent common ancestor of each AARS family, and compared with the same estimates from their extant forms. These results show an increase in phase II amino acid use for assembling AARS proteins through time. The increase in amino acid frequencies for two such families (CysRS and IleRS) are further broken down, with phase II amino acids coloured green. Analogous plots for the remaining families are presented in Supplementary Figures S40 and S41.

