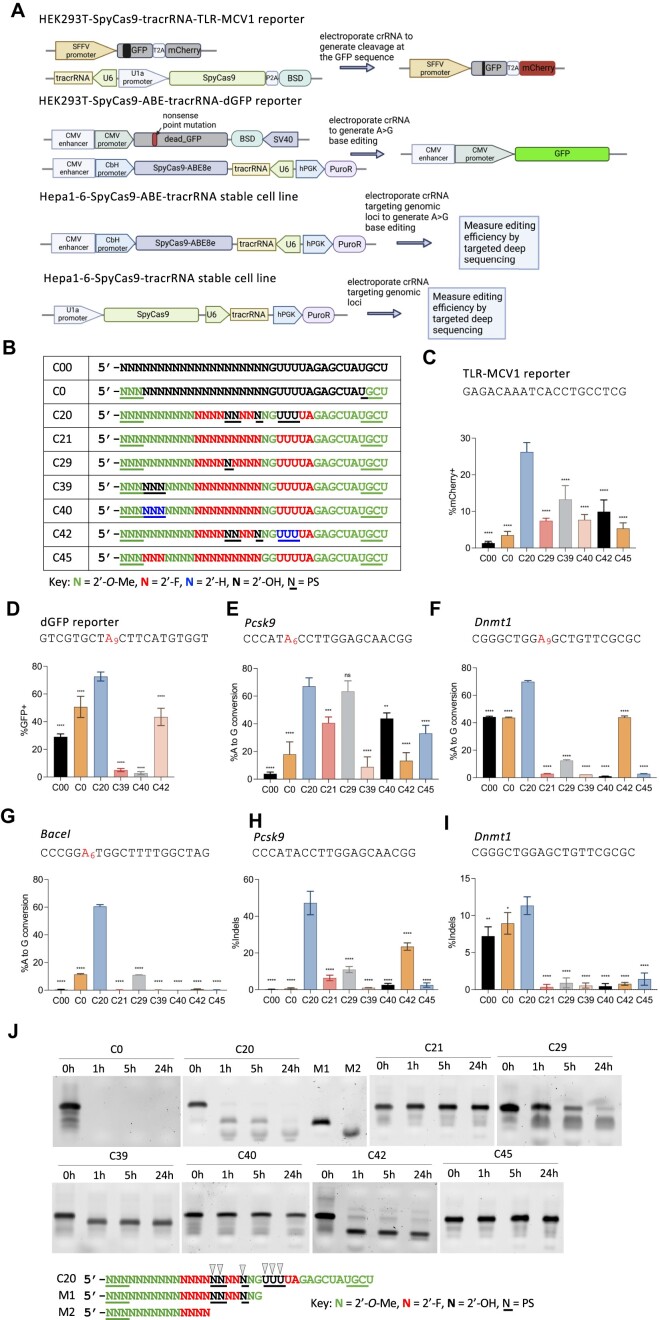
Figure 1.
Stable cell lines established and activities of the previously engineered, chemically modified crRNA. (A) Schematic representation of stable cell lines for screening the activities of different chemical modifications of crRNA. Top panel: a stable HEK293T cell line that expresses SpyCas9 nuclease, tracrRNA, and the TLR-MCV1 traffic light reporter. Electroporation of crRNAs targeting the broken GFP sequence will generate frameshift mutations that place the mCherry coding sequence in-frame, allowing the editing efficiency to be estimated by mCherry + quantification via flow cytometry. Second panel: a stable HEK293T cell line that expresses the adenine base editor SpyCas9-ABE8e, the tracrRNA, and a fluorescent reporter gene that consists of a G-to-A nonsense mutation within the GFP coding sequence [dead_GFP (dGFP)]. Electroporation of crRNA will restore GFP fluorescence by an A-to-G edit that reverses the mutation, and the editing efficiency can then be measured by GFP + quantification via flow cytometry. Third panel: a stable mouse Hepa1-6 cell line that expresses SpyCas9-ABE8e and tracrRNA. Electroporation of crRNA targeting endogenous genomic loci will generate A-to-G edits that can then be measured by targeted amplicon deep sequencing. Bottom panel: a stable mouse Hepa1-6 cell line that expresses SpyCas9 and tracrRNA. Electroporation of crRNA targeting endogenous genomic loci will generate Indels that can be measured by amplicon deep sequencing. (B) The modification patterns of the previously engineered, heavily or fully modified crRNAs used in panels (C–I) Modified crRNAs targeting different sequences were delivered by electroporating 100 pmol crRNA into 5 × 10⁴ cells in different stable cell lines: (C), HEK293T-SpyCas9-tracrRNA-TLR-MCV1 reporter; (D) HEK293T-SpyCas9-ABE-tracrRNA-dGFP reporter; (E–G), Hepa1-6-SpyCas9-ABE-tracrRNA stable cell line for three endogenous loci, and (H–I), Hepa1-6-SpyCas9-tracrRNA stable cell line for two endogenous loci, as indicated. The editing efficiencies were quantified by either flow cytometry analysis (C, D) or targeted amplicon deep sequencing (E–I) (n = 3 biological replicates). Data represent mean ± SD; ns, P > 0.05, ** P < 0.01; *** P < 0.001; **** P < 0.0001 (one-way ANOVA; C20 was used as control in multiple comparisons). (J) Stability of partially and fully-modified crRNAs shown in (B) in 10% non-heat-inactivated FBS at 37°C. Digested fragments were resolved by 10% urea-denaturing polyacrylamide gel electrophoresis (PAGE) followed by SYBR Gold staining. M1 and M2 are markers representing potential C20 degradation products, with black arrows representing potential cleavage sites.

