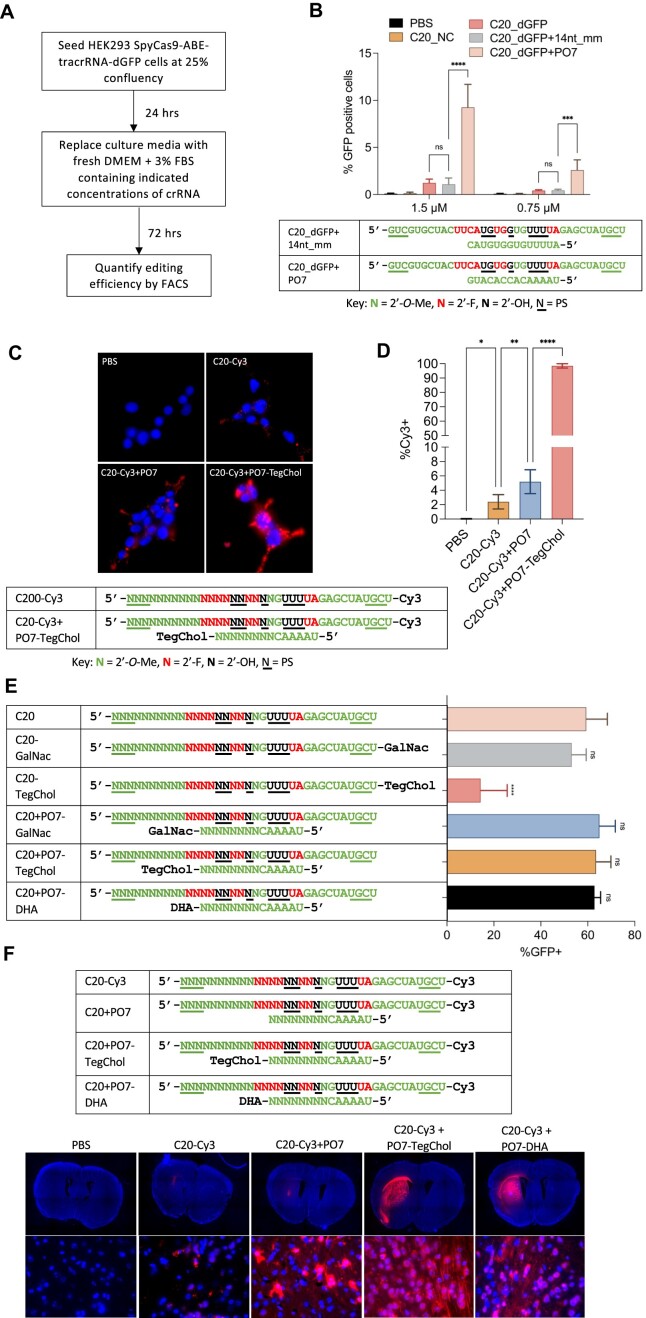
Figure 3.
P.O.s promote editing by C20 passive uptake and support a wide range of conjugates for enhanced in vivo uptake and distribution in the adult mouse CNS. (A) Schematic representation of the experimental process that tests the editing by C20 (with and without P.O.) by passive uptake. (B) Editing efficiency by passive uptake (in the absence of transfection or electroporation) of C20, with and without P.O., added to the culture media at the indicated concentrations. C20 with spacer sequence targeting the DnmtI site (C20_NC) was used as a negative control. A 14 nt mismatched and fully 2′-O-Me modified oligo (14nt_mm) served as a control for PO7. Base editing efficiency was measured using the HEK293T-SpyCas9-ABE-tracrRNA-dGFP reporter and flow cytometry analysis (n = 3 biological replicates). Data represent mean ± SD; ns, P > 0.05; *** P < 0.001; **** P < 0.0001 (one-way ANOVA). (C) Cellular uptake of Cy3-labeled C20 with or without P.O. Live cell images were acquired using a Leica fluorescent microscope with 63x magnification. Blue, NucBlue; red, Cy3. (D) Quantification of percentage of Cy3-positive cells shown in Figure 3C using flow cytometry (n = 3 biological replicates). Data represent mean ± SD; * P < 0.05; ** P < 0.01; **** P < 0.0001 (one-way ANOVA). (E) 100 pmol C20, with and without conjugates, P.O.s, or both (as shown), were electroporated into 5 × 10⁴ HEK293T-SpyCas9-ABE-tracrRNA-dGFP reporter cells. Editing efficiencies were then measured by flow cytometry analysis. GalNac, trivalent N-acetylgalactosamine; DHA, docosahexaenoic acid; TegChol, tetra-ethylene-glycol-linked cholesterol. Data represent mean ± SD; ns, P > 0.05; **** P < 0.0001 (one-way ANOVA; C20 was used as control in multiple comparisons). (F) Top panel: designs and chemical modification patterns of Cy3-labeled oligos. Bottom panel: in vivo distribution of Cy3-labeled C20, with and without P.O.s and lipid conjugates as indicated, in mouse CNS after intrastriatal injection (n = 3 mice per group; images for the other two biological replicates are shown in Supplementary Figure 3A). Images were acquired using a Leica fluorescent microscope. Upper row of images: 5× magnification tile scan; bottom row: 63x magnification. Blue, DAPI; red, Cy3.

