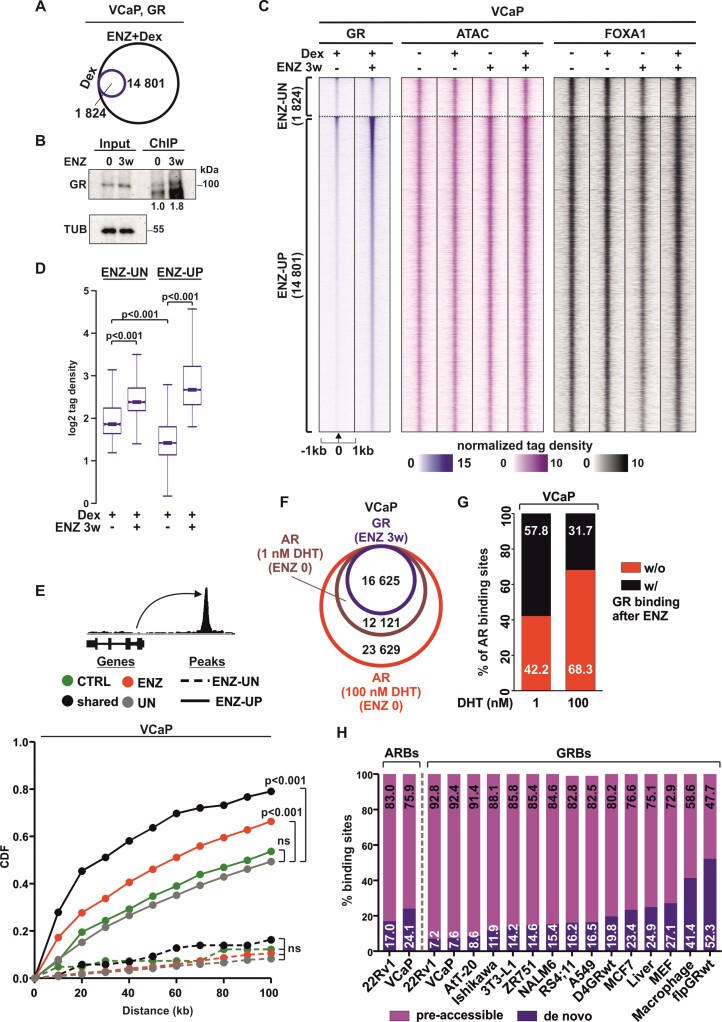
Figure 2.
GR preferably binds to pre-accessible chromatin sites in prostate cancer cells. (A) Venn diagrams of GR chromatin binding in VCaP cells from GR ChIP-seq after Dex (blue circle) or ENZ + Dex (black circle) treatment. (B) Immunoblotting of GR from GR ChIP samples VCaP ENZ 0 and ENZ 3w cells. Immunoblotting of GR and TUB from ChIP input used as control. Quantification of GR chromatin levels to input is shown below the immunoblot. (C) GR ChIP-seq, ATAC-seq, and FOXA1 ChIP-seq profiles at ENZ-UN and ENZ-UP sites in VCaP ENZ 0 and ENZ 3w cells. ENZ-UN represents unchanged (FDR > 0.1 and FC < 2) and ENZ-UP increased (FDR < 0.1 and FC > 2) GR binding sites. Each heatmap represents ± 1 kb around the center of the GR peak. Binding intensity (tags per bp per site) scale is noted below on a linear scale. (D) Box plots represent the normalized log2 tag density of GR ChIP-seq at ENZ-UN and ENZ-UP sites. Statistical significance calculated using One-way ANOVA with Bonferroni post hoc test. (E) Association of Dex-regulated genes in VCaP ENZ 0 and ENZ 3w cells to ENZ-UN and ENZ-UP GR binding sites. Different subsets of Dex-regulated genes are color coded, and ENZ-UN depicted as dotted line and ENZ-UP as solid line. Statistical significance calculated with Kolmogorov–Smirnov test. (F) Venn diagrams of GR (ENZ 3w cells) and AR (ENZ 0 cells) chromatin binding in VCaP cells from GR ChIP-seq (blue circle) and AR ChIP-seq treated with 1 nM (magenta circle) or 100 nM (red circle) of DHT. (G) Bar graphs depict percentage overlap of AR binding sites with (black) or without (red) GR binding. (H) Bar graphs depict percentage overlap of AR binding sites (ARBs) or GR binding sites (GRBs) with pre-accessible (purple) or de novo (blue) chromatin sites. Cell lines or tissues analyzed are indicated below the bar graphs. All heatmaps and box plots are normalized to a total of 10 million reads.

