Figure 3.
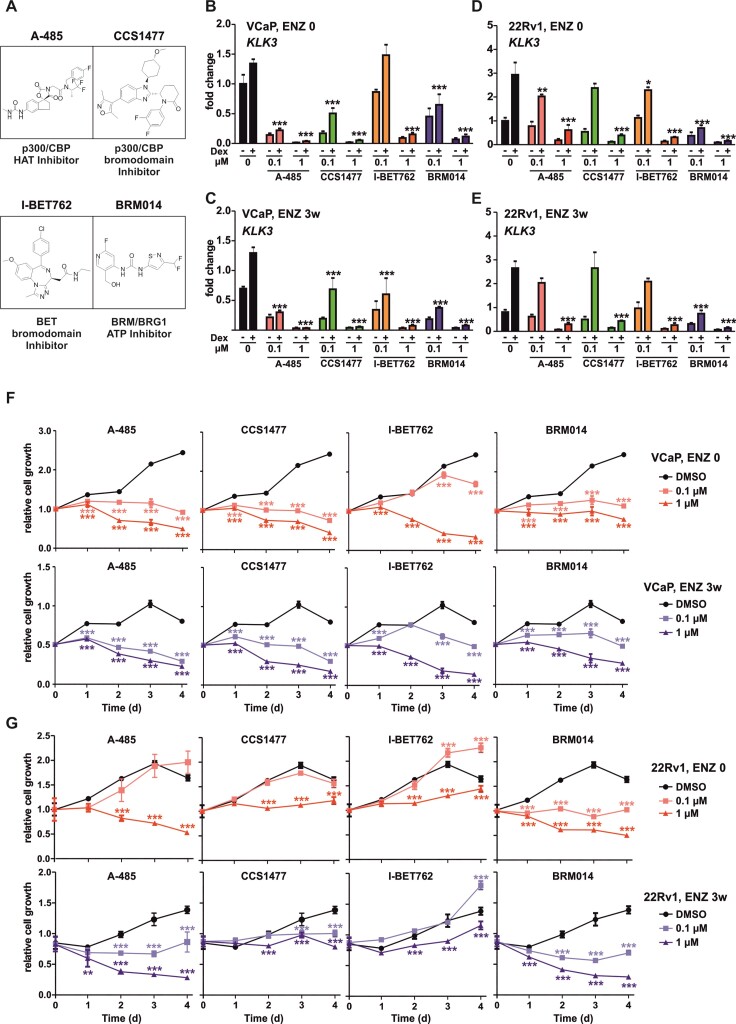
Inhibition of p300’s enzymatic activity hinders cell proliferation and GR transcriptional regulation. (A) Depiction of chemical structures of coregulator inhibitors. A-485, p300/CBP histone acetyl transferase (HAT) domain inhibitor; CCS1477, p300/CBP bromodomain inhibitor; I-BET762, bromodomain and extra terminal domain (BET) bromodomain inhibitor; BRM014, BRM/BRG1 ATP domain inhibitor. (B–E) Bar graphs depict KLK3 gene expression analysis in VCaP ENZ 0 (B), VCaP ENZ 3w (C), 22Rv1 ENZ 0 (D), and 22Rv1 ENZ 3w (E) cells treated with or without Dex in the presence or absence of 0.1 or 1 μM of indicated inhibitor. Bars represent mean ± SD, n= 3. Statistical significance calculated using one-way ANOVA with Bonferroni post hoc test. (F, G) Line graphs depict change in cell proliferation as function of time in VCaP (F) and 22Rv1 (G) ENZ 0 and ENZ 3w cells with or without indicated chemical inhibitor treatment. Each data point represents mean ± SD, n = 3. Statistical significance calculated using Two-way ANOVA with Bonferroni post hoc test. *P< 0.05; **P< 0.01; ***P< 0.001.

