Figure 4.
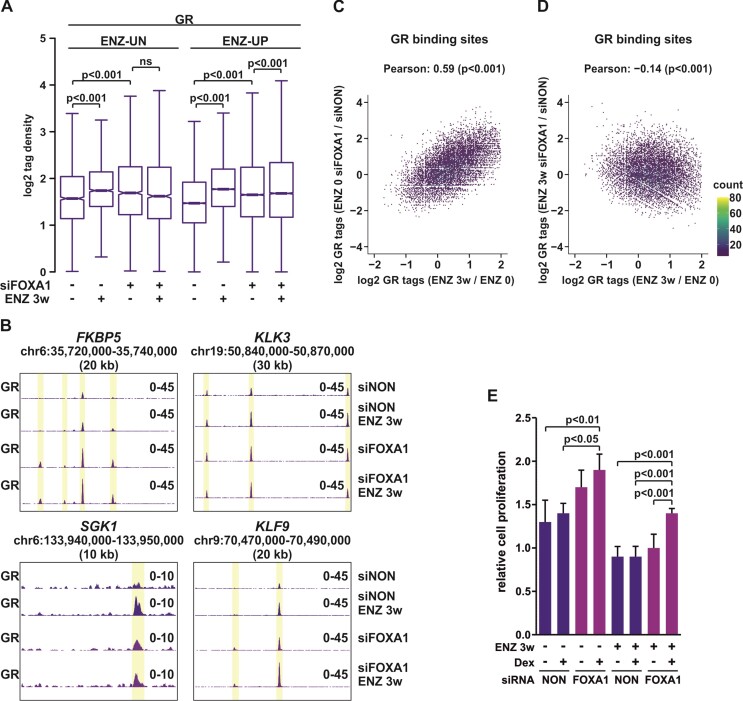
GR chromatin binding is potentiated upon FOXA1 depletion. (A) Box plots represent log2 tag density of GR ChIP-seq at ENZ-UN and ENZ-UP sites in VCaP ENZ 0 and ENZ 3w cells with or without siFOXA1 treatment. Statistical significance calculated using One-way ANOVA with Bonferroni post hoc test. (B) Genome browser track examples of GR ChIP-seq at FKBP5, KLK3, SGK1, and KLF9 loci in VCaP ENZ 0 and ENZ 3w cells treated with siNON or siFOXA1. (C, D) Scatter plots of GR ChIP-seq log2 tag density of ENZ 3w/ENZ 0 (x-axis) and ENZ 0 siFOXA1/ENZ 0 siNON (y-axis) (C), and ENZ 3w/ENZ 0 (x-axis) and ENZ 3w siFOXA1/ENZ 3w siNON (y-axis) (D). (E) Bar graphs depict relative cell proliferation in VCaP ENZ 0 and ENZ 3w cells treated with or without Dex in the presence or absence of siFOXA1 for 4 days. Data is normalized to cell proliferation at day 0, and represents mean ± SD, n = 3–6. Statistical significance calculated using One-way ANOVA with Bonferroni post hoc test. All genome browser tracks, scatter and box plots are normalized to a total of 10 million reads.

