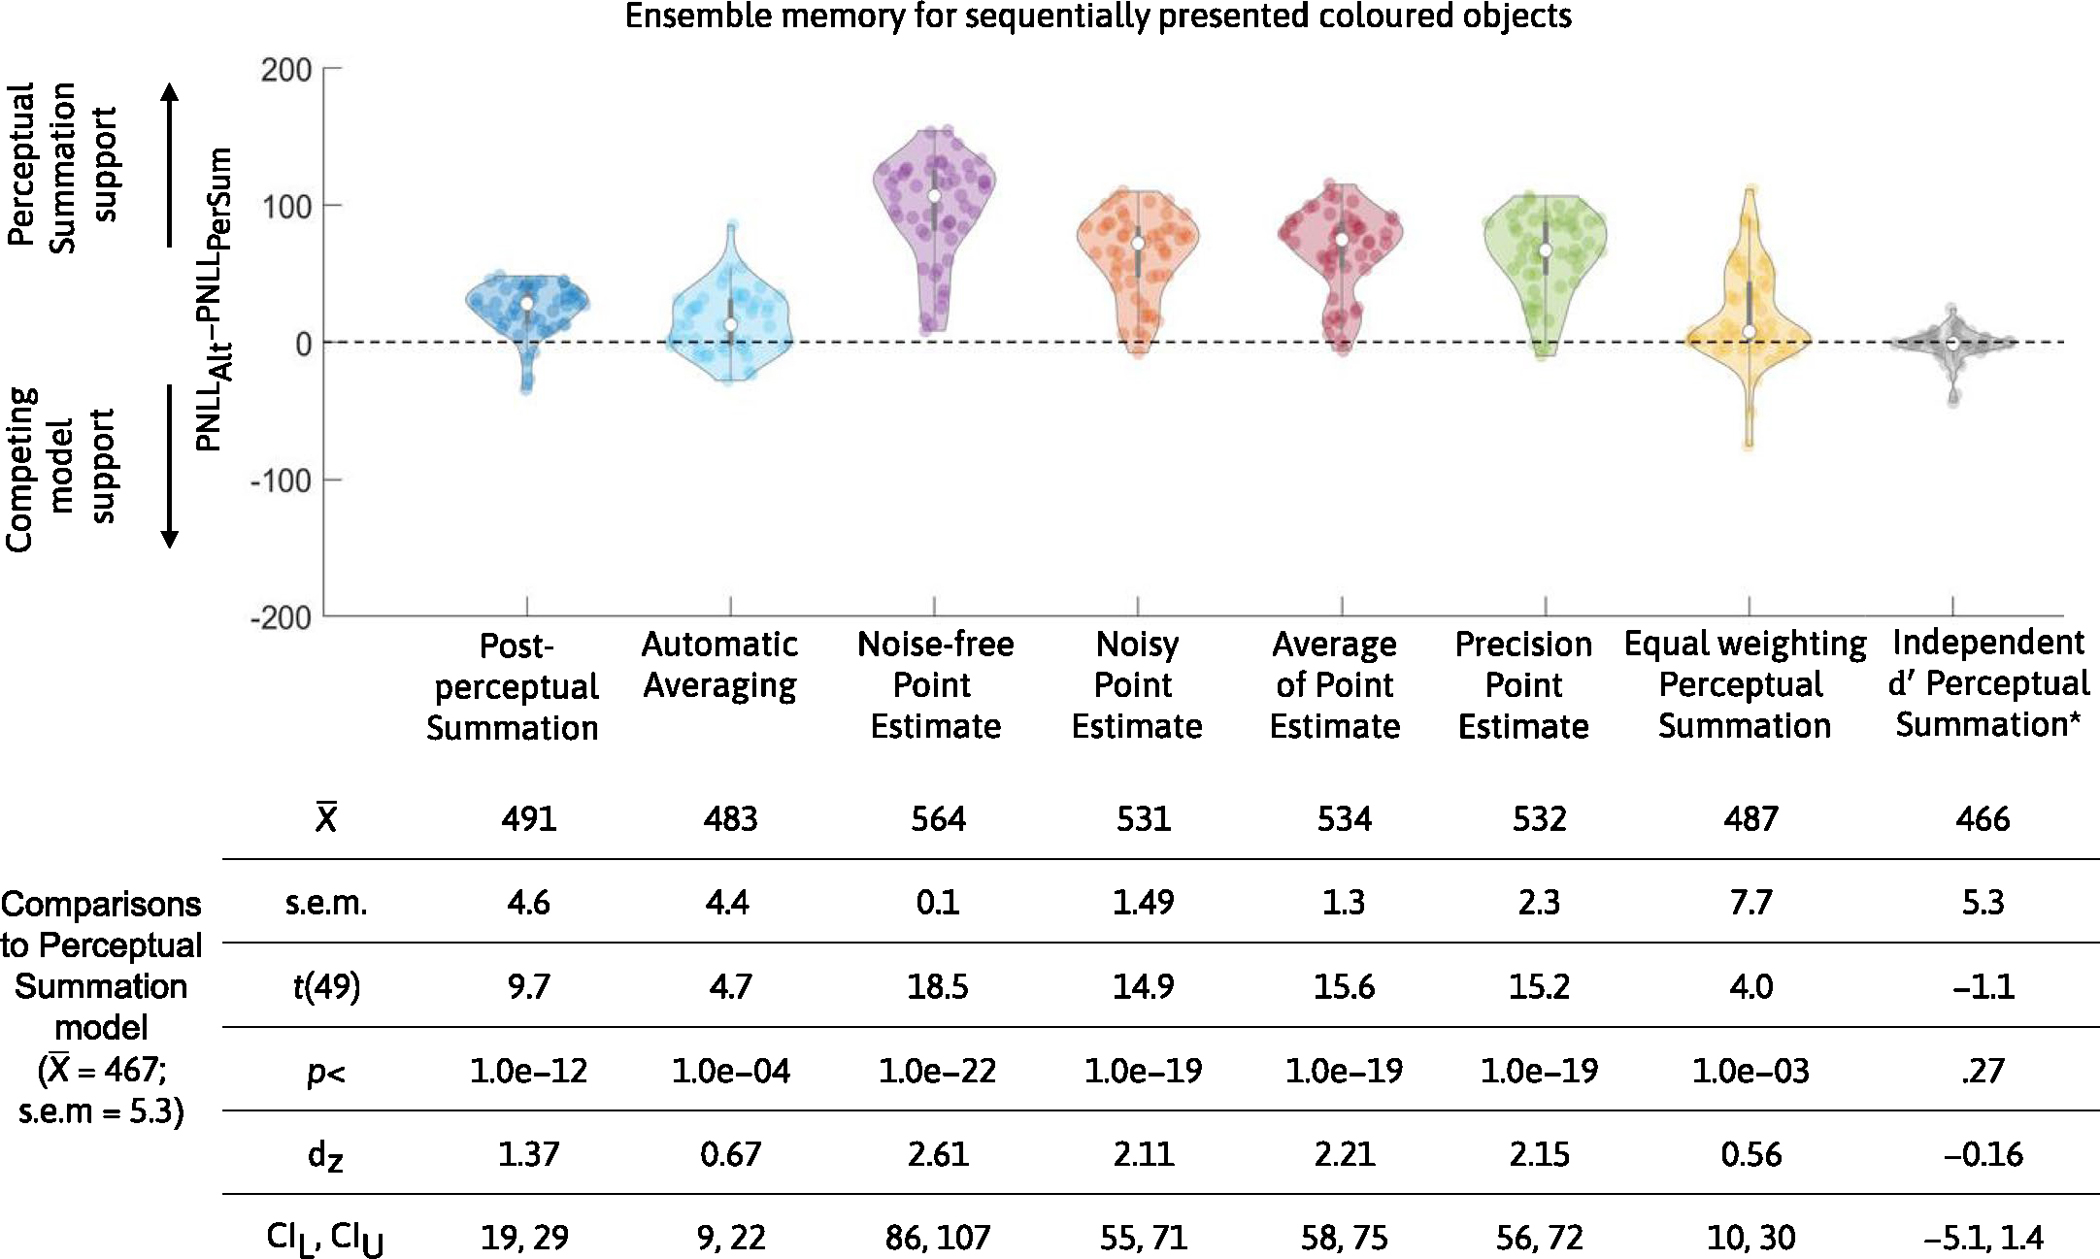
Extended Data Fig. 6 |. Comparison in predictive accuracy between Sequential Perceptual Summation model and competing models of ensemble memory for sequentially presented stimuli.

The top panel shows violin plots of the difference in predicted negative log likelihood scores between each of the eight alternative competing models (PNLLAlt) and the main Sequential Perceptual Summation model (PNLLPerSum) (n = 50 participants). Lower values of PNLL indicate higher predictive accuracy, therefore, PNLL difference scores higher (or lower) than zero indicate support for the Sequential Perceptual Summation (or a competing) model. The vast majority of participants are better predicted by the Sequential Perceptual Summation model than any of the alternatives. Note that the baseline here is the Sequential Perceptual Summation model that relies on fitting a decay rate. The independent d’ Perceptual Summation model, the last model above, is the same model but without this parametric assumption about how d’ changes across the items in the working memory task. This independent model is instead one in which we used separate d’ estimates to quantify familiarity of items as a function of serial position, rather than a single d’ and rate parameter. This model is marked with an * because it is also a version of the Sequential Perceptual Summation model and so shows comparable predictive accuracy to the main Sequential Perceptual Summation model we use, as expected. The bottom panel shows a table with a summary of descriptive and inferential statistics from all comparisons in Experiment 5, including the mean and standard error of the mean across participants. PNLL values were compared with a paired two-tailed t-test, corrected for multiple comparisons and for all comparisons between competing models p-values were statistically significant (p < 0.001).
