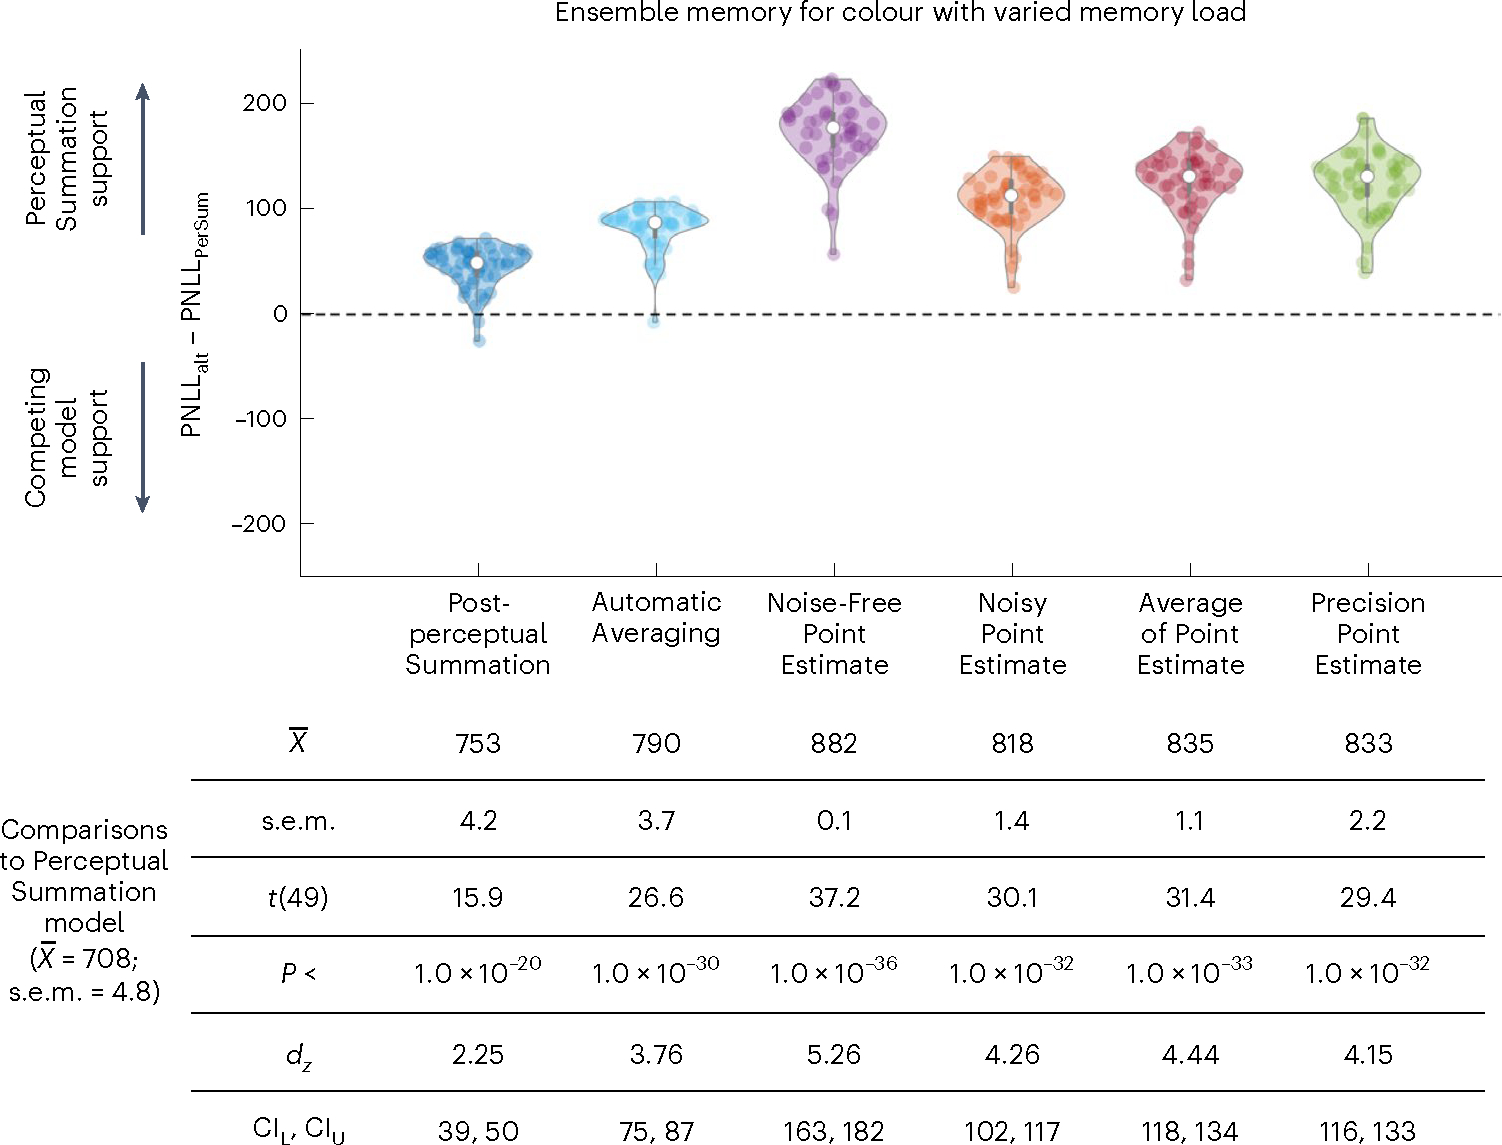
Fig. 6 |. Comparison in predictive accuracy between the Perceptual Summation model and competing models of ensemble memory for colour with set size manipulation.

Top, violin plots based on the difference in PNLL scores between each of the six alternative competing models (PNLLalt) and the main Perceptual Summation model (PNLLPerSum) for Experiment 1 (n = 50 participants). Lower PNLL values indicate higher predictive accuracy; therefore, PNLL difference scores higher (or lower) than zero indicate support for the Perceptual Summation (or a competing) model. In both experiments, the vast majority of participants were better predicted by the Perceptual Summation model than by any of the alternatives. Bottom, descriptive and inferential statistics from all comparisons in Experiment 1, including the mean and standard error of the mean across participants. The PNLL values were compared with a paired two-tailed t-test, corrected for multiple comparisons, and all P values were statistically significant (P < 0.001).
