Figure 6.
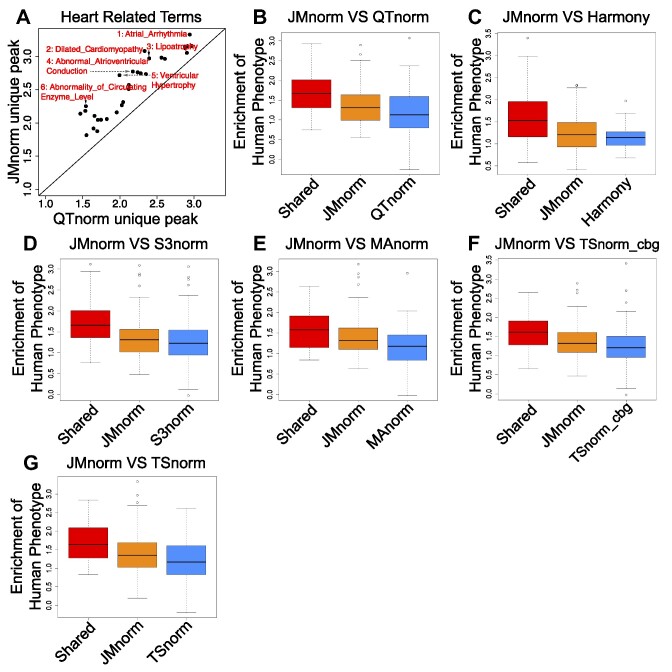
Comparative analysis of JMnorm and other methods using DNase-seq peak calling results. (A) A scatterplot of enrichments of the Human Phenotype terms in heart-specific peaks (relative to lung) uniquely identified by QTnorm (x-axis) or JMnorm (y-axis). The displayed terms are the top 30 most significantly enriched terms identified by both methods. (B) A box plot of Human Phenotype terms enriched in shared and uniquely identified QTnorm's or JMnorm's peaks across 100 randomly selected cell type pairs. (C–G) same as (B), for comparison between (C) JMnorm and Harmony, (D) JMnorm and S3norm, (E) JMnorm and MAnorm, (F) JMnorm and TSnorm_cbg, and (G) JMnorm and TSnorm.

