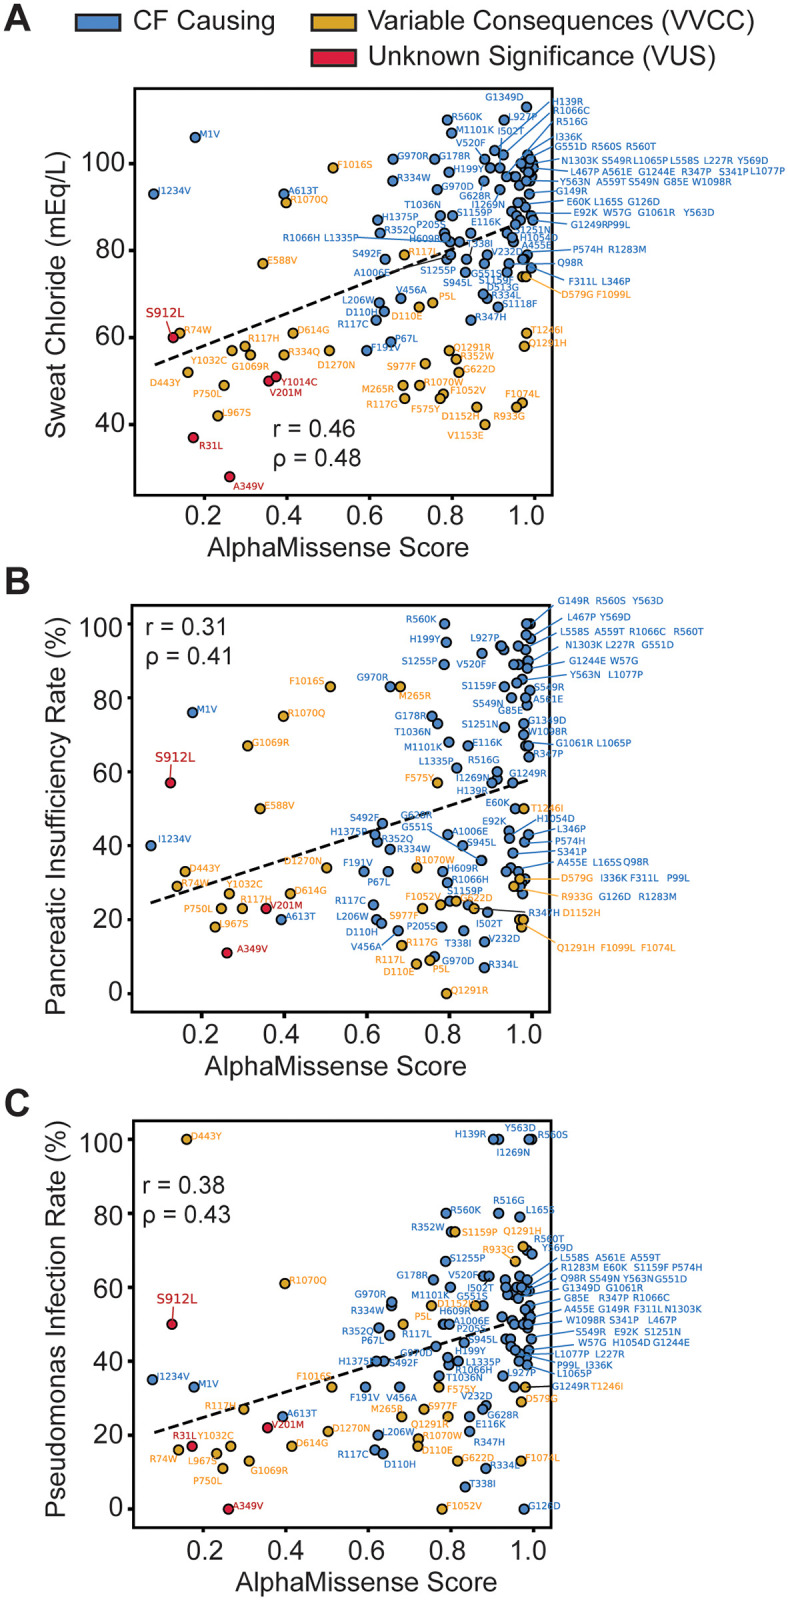
Fig 2. Benchmarking AlphaMissense against cystic fibrosis patient pathogenicity metrics.

A. AM score plotted against sweat chloride levels in milliequivalents per liter (mEq/L) for 123 missense variants. Healthy sweat chloride levels were <30 mEq/L. CF-causing variants were shown in blue, variants of variable clinical consequence (VVCC) were shown in yellow, and variants of unknown significance (VUS) were shown in red (as annotated in CFTR2). A modest linear correlation (Pearson Coefficient r = 0.46, Spearman Coefficient ρ = 0.48) was observed. B. AM score plotted against pancreatic insufficiency rates in percent for 116 missense variants. Less correlation (Pearson Coefficient r = 0.31, Spearman Coefficient ρ = 0.41) was observed than with sweat chloride, notably many VVCCs were predicted pathogenic AM score but demonstrate a low pancreatic insufficiency rate. Colors annotated as in A. C. AM score plotted against P. aeruginosa infection rates in percent for 114 missense variants. Colors annotated as in A. Linear correlation (Pearson Coefficient r = 0.38, Spearman Coefficient ρ = 0.43) is shown. Interestingly, S912L, a variant of unknown significance is predicted to be benign but shows a high sweat chloride, pancreatic sufficiency, and P. aeruginosa infection rate compared to variants with similar scores.
