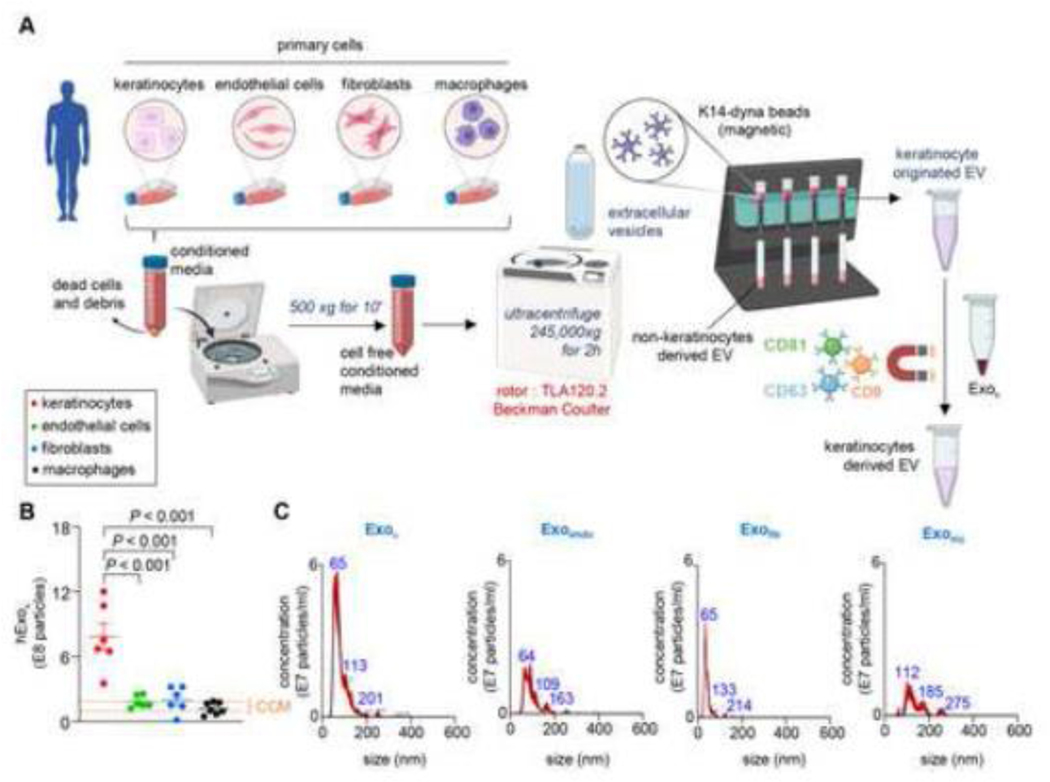
Figure 2: Intermediate filament protein keratin 14 are specific for vesicles of keratinocyte origin.
A, Schematic diagram showing enrichment of KRT14 expressing exosomes in primary human adult epidermal keratinocytes, primary human dermal microvascular endothelial cells, primary human adult dermal fibroblasts, and monocytes derived macrophages. B-C, Quantitative KRT14+ exosome abundance (B) and representative NTA images showing the size distribution of KRT14 expressing exosomes (C) in primary human adult epidermal keratinocytes, primary human dermal microvascular endothelial cells, primary human adult dermal fibroblasts, and monocytes derived mϕ (n=6). The orange dashed line shows the range of particles obtained from cell culture media (CCM) containing 10% exosome-depleted serum. Data in B were shown as mean ± SEM and were analyzed by one-way ANOVA with the post-hoc Bonferroni’s multiple comparison test. Figure A was created with BioRender.com.

