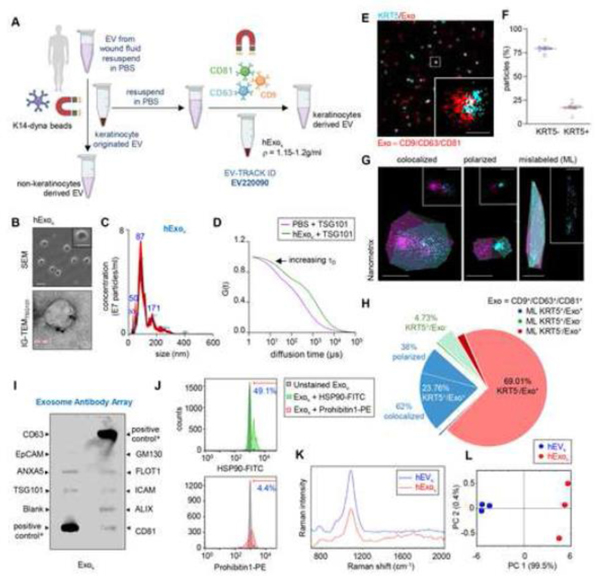
Figure 3: Isolation and characterization of keratinocyte-originated exosome from human wound fluid.
A, Schematic diagram showing enrichment of in human wound fluid isolated from the sponge dressings of patients undergoing NPWT by using differential ultracentrifugation. This method was reported in EV-track. (EV220090). B, Representative SEM image of showing cup-shaped morphology. Scale, 200nm. Inset showing a zoomed morphology of . Scale, 100nm. Representative immunogold TEM showing TSG101 on isolated from human chronic wound fluids. Scale, 100nm. C, Representative nanoparticle tracking analysis showing the size distribution of isolated from human wound fluid. (n=10). D, Binding of TSG-101 PE with the human keratinocyte-originated exosome was tested by autocorrelation curves as determined by fluorescence correlation spectroscopy (FCS). shows the increase in diffusion time. E, Representative super-resolution dSTORM immunofluorescence images of keratinocyte originated exosome showing the abundance of tetraspanins markers (CD9, CD63, CD81) on exosome (red) and keratin markers KRT5 (cyan). Scale, 50nm. F, Quantification of KRT5- and KRT5+ . Each dot corresponds to one quantified ROI, except the blue and red dots, which correspond to the mean of biological replicates. At least 6 ROI per sample. (n=4). G, The colocalization of exosome markers and KRT5 markers was analyzed using the Nanometrix software showing colocalized, polarized and mislabeled (ML) exosomes. Scale,100nm H, Pie diagram showing analysis of dSTORM image datasets using Nanometrix. ML, mislabeled. I, Antibody array of keratinocyte originated exosome from human wound fluid. PC, labeled positive control for HRP detection; GM130, cellular contamination marker. ALIX, TSG101, CD9, CD63, CD81, FLOT1, exosomal marker; EpCAM, epithelial cell adhesion molecule; ANXA5, Annexin 5. * Positive control for HRP detection derived from human serum exosomes. J, Flow cytometric analysis of conjugated with super magnetic dynabeads™ functionalized with CD63, CD9, and CD81 showing binding of HSP90-FITC (exosome marker) and Prohibitin1-PE (contaminants associated with exosome) antibodies. The histogram demonstrates the shift in FITC and PE fluorescence after binding with HSP90. The mean percentage of beads with exosomes showing FITC and PE fluorescence was mentioned over the marker bar. K, Raman fingerprint of and isolated from chronic wound fluid. L, PC2 vs PC1 2D-score plots for and isolated from chronic wound fluid constructed from principal component analysis of Raman spectra. (n=3) plot. Figure 3A was created with BioRender.com.

