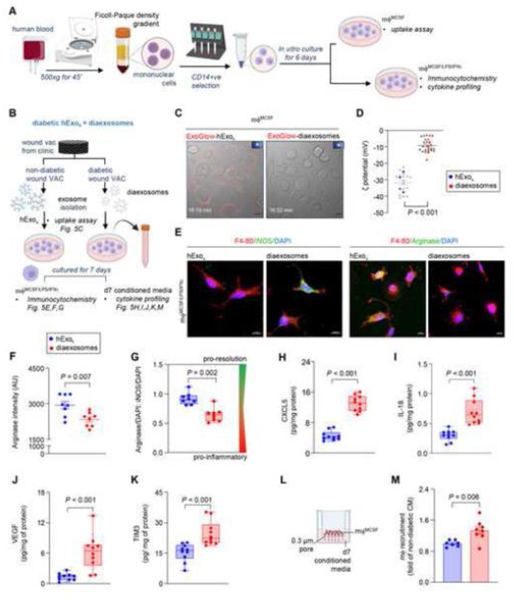
Figure 5: Diaexosomes failed to mount the inflammatory response in mf required for timely resolution of inflammation.
A, Schematic diagram showing the isolation of blood monocyte derived mϕ using MCSF and priming them to pro-inflammatory state using LPS and INFγ. B, Schematic diagram showing the experimental design to test the significance of and diaexosomes in human chronic wound fluid on mϕ. C, Live-cell confocal images showing compromised uptake of and diaexosomes by day 6 mϕ . Scale, 10 μm. and diaexosomes were stained with DiD before imaging.  Indicate movies in the supplement. D, Zeta potentials of and diaexosomes at physiological pH (pH-7.4). Each grey dot corresponds to one technical replicate, and the blue and red dots correspond to the mean of each biological replicates. (n=4). E, Representative immunofluorescence staining of F 4–80 (red) in mϕ () with either iNOS (green, pro-inflammatory mϕ marker) or Arginase (green pro-resolution mϕ marker) with DAPI counterstaining at day 7. Scale, 10 μm. F-G, Quantification of Arginase intensity (F) and the ratio of Arginase to iNOS intensity (G) in at day 7. H-K, Quantitative abundance of CXCL5 (H), IL-18 (I), VEGF (J), and TIM3 (K) in mϕ conditioned media exposed to either or diaexosomes for 7 days. L, Schematic diagram showing the experimental set up for mϕ recruitment assay. M, mϕ recruitment in response to the conditioned media exposed to either or diaexosomes for 7 days. Data in D, F, G, H, I, J, K and M were shown as mean ± SEM and analyzed by Student’s t-test. Figure A and B were created with BioRender.com.

