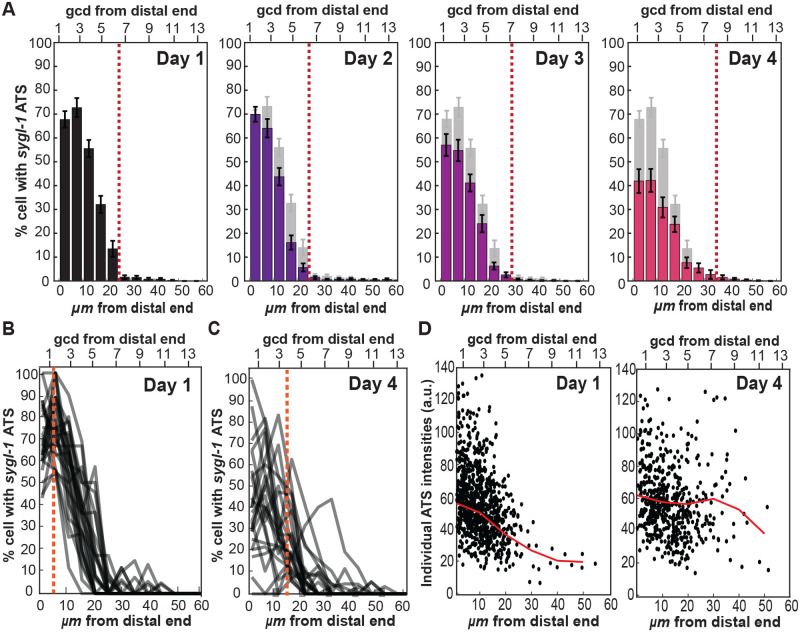
Fig. 3.
Aging induces a progressive shift in the spatial pattern of Notch transcriptional activation. (A) The percentage of cells containing at least one sygl-1 ATS was plotted as a function of the distance from the distal end of the gonad for each age to estimate the probability of Notch-dependent transcriptional activation in each position relative to the distal end. The red dashed line marks the proximal boundary of the GSC pool, where the percentage is below 2.5%. n=27, 25, 26, and 24 gonads for Day 1, 2, 3, and 4 respectively. (B,C) Line plots of the percentage of cells containing at least one sygl-1 ATS against the distance from the distal end of individual gonads overlaid at Day 1 (B) or Day 4 (C). (A) is the average of all these individual plots. The orange dashed line indicated the average peak of all the percentage of cells containing at least one sygl-1 ATS. (D) The individual sygl-1 ATS intensities are plotted against the distance from the distal end of Day 1 and 4. Each dot represents one sygl-1 ATS. n=931 and 550 ATS for Day 1 and 4, respectively.

